Taiwanese vs Immigrants from Venezuela In Labor Force | Age 30-34
COMPARE
Taiwanese
Immigrants from Venezuela
In Labor Force | Age 30-34
In Labor Force | Age 30-34 Comparison
Taiwanese
Immigrants from Venezuela
84.6%
IN LABOR FORCE | AGE 30-34
29.4/ 100
METRIC RATING
188th/ 347
METRIC RANK
84.0%
IN LABOR FORCE | AGE 30-34
0.9/ 100
METRIC RATING
245th/ 347
METRIC RANK
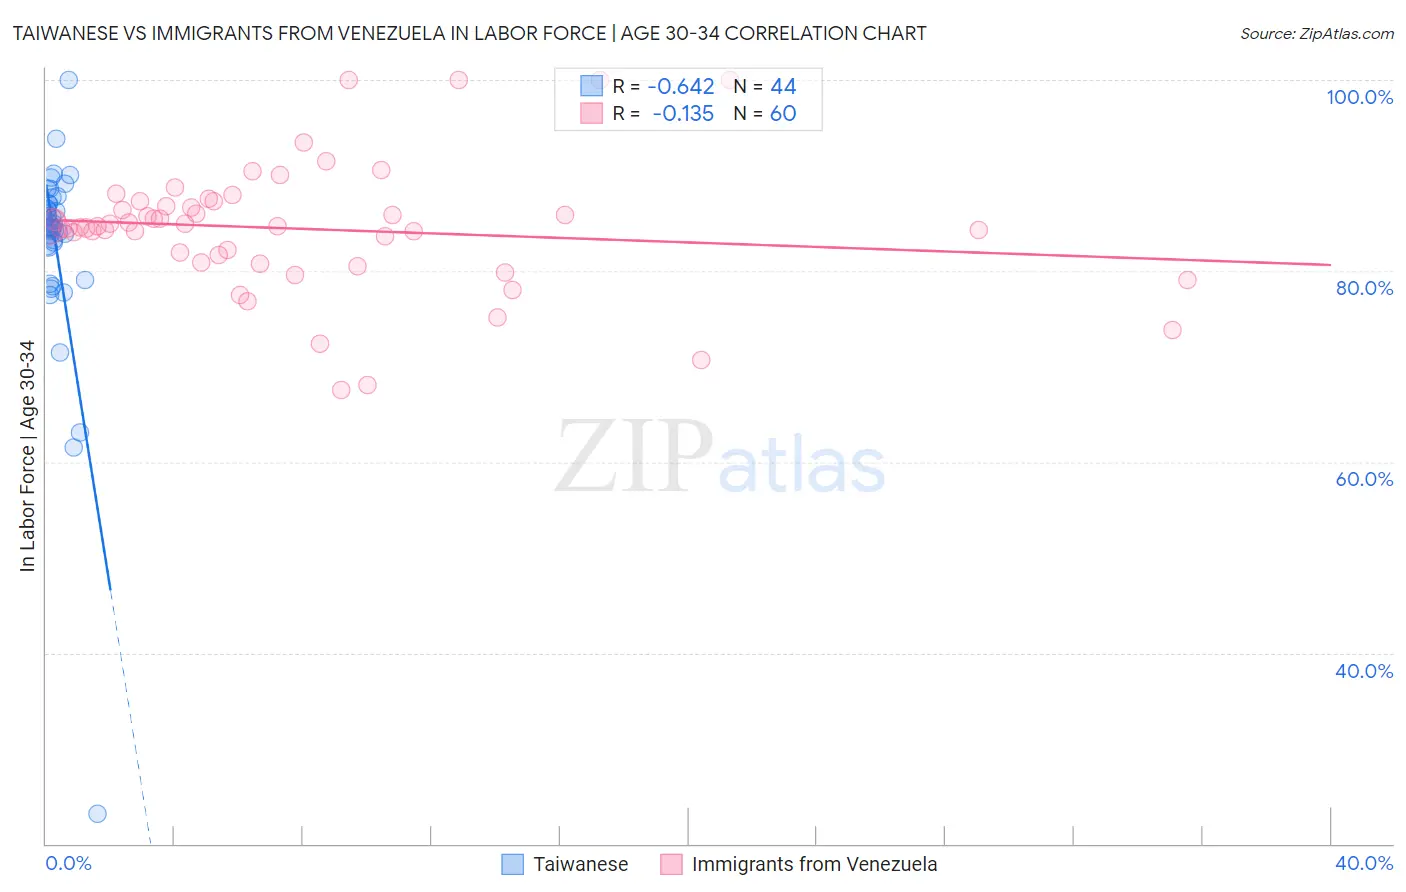
Taiwanese vs Immigrants from Venezuela In Labor Force | Age 30-34 Correlation Chart
The statistical analysis conducted on geographies consisting of 31,720,118 people shows a significant negative correlation between the proportion of Taiwanese and labor force participation rate among population between the ages 30 and 34 in the United States with a correlation coefficient (R) of -0.642 and weighted average of 84.6%. Similarly, the statistical analysis conducted on geographies consisting of 287,808,791 people shows a poor negative correlation between the proportion of Immigrants from Venezuela and labor force participation rate among population between the ages 30 and 34 in the United States with a correlation coefficient (R) of -0.135 and weighted average of 84.0%, a difference of 0.67%.
In Labor Force | Age 30-34 Correlation Summary
| Measurement | Taiwanese | Immigrants from Venezuela |
| Minimum | 23.1% | 67.5% |
| Maximum | 100.0% | 100.0% |
| Range | 76.9% | 32.5% |
| Mean | 82.5% | 84.4% |
| Median | 84.6% | 84.7% |
| Interquartile 25% (IQ1) | 82.5% | 81.3% |
| Interquartile 75% (IQ3) | 87.0% | 87.1% |
| Interquartile Range (IQR) | 4.5% | 5.8% |
| Standard Deviation (Sample) | 11.3% | 6.7% |
| Standard Deviation (Population) | 11.2% | 6.7% |
Similar Demographics by In Labor Force | Age 30-34
Demographics Similar to Taiwanese by In Labor Force | Age 30-34
In terms of in labor force | age 30-34, the demographic groups most similar to Taiwanese are Immigrants from Congo (84.6%, a difference of 0.0%), Costa Rican (84.6%, a difference of 0.0%), Nigerian (84.5%, a difference of 0.0%), Immigrants from Philippines (84.6%, a difference of 0.020%), and Immigrants from North America (84.6%, a difference of 0.030%).
| Demographics | Rating | Rank | In Labor Force | Age 30-34 |
| Moroccans | 40.3 /100 | #181 | Average 84.6% |
| Barbadians | 36.7 /100 | #182 | Fair 84.6% |
| Immigrants | Canada | 35.0 /100 | #183 | Fair 84.6% |
| Immigrants | North America | 33.3 /100 | #184 | Fair 84.6% |
| Immigrants | Philippines | 31.5 /100 | #185 | Fair 84.6% |
| Immigrants | Congo | 29.7 /100 | #186 | Fair 84.6% |
| Costa Ricans | 29.6 /100 | #187 | Fair 84.6% |
| Taiwanese | 29.4 /100 | #188 | Fair 84.6% |
| Nigerians | 28.9 /100 | #189 | Fair 84.5% |
| Immigrants | Zaire | 25.8 /100 | #190 | Fair 84.5% |
| Hungarians | 24.8 /100 | #191 | Fair 84.5% |
| Scandinavians | 24.7 /100 | #192 | Fair 84.5% |
| Immigrants | Costa Rica | 23.9 /100 | #193 | Fair 84.5% |
| Immigrants | Afghanistan | 23.5 /100 | #194 | Fair 84.5% |
| Koreans | 23.2 /100 | #195 | Fair 84.5% |
Demographics Similar to Immigrants from Venezuela by In Labor Force | Age 30-34
In terms of in labor force | age 30-34, the demographic groups most similar to Immigrants from Venezuela are Basque (84.0%, a difference of 0.0%), Central American (84.0%, a difference of 0.0%), British West Indian (84.0%, a difference of 0.020%), Immigrants from Caribbean (84.0%, a difference of 0.030%), and Portuguese (84.0%, a difference of 0.030%).
| Demographics | Rating | Rank | In Labor Force | Age 30-34 |
| Immigrants | Barbados | 1.4 /100 | #238 | Tragic 84.0% |
| English | 1.4 /100 | #239 | Tragic 84.0% |
| Venezuelans | 1.3 /100 | #240 | Tragic 84.0% |
| Immigrants | Portugal | 1.2 /100 | #241 | Tragic 84.0% |
| Immigrants | Oceania | 1.1 /100 | #242 | Tragic 84.0% |
| Immigrants | Caribbean | 1.1 /100 | #243 | Tragic 84.0% |
| Basques | 0.9 /100 | #244 | Tragic 84.0% |
| Immigrants | Venezuela | 0.9 /100 | #245 | Tragic 84.0% |
| Central Americans | 0.9 /100 | #246 | Tragic 84.0% |
| British West Indians | 0.8 /100 | #247 | Tragic 84.0% |
| Portuguese | 0.8 /100 | #248 | Tragic 84.0% |
| Immigrants | Dominica | 0.7 /100 | #249 | Tragic 84.0% |
| Immigrants | Iraq | 0.7 /100 | #250 | Tragic 83.9% |
| Nicaraguans | 0.6 /100 | #251 | Tragic 83.9% |
| Bahamians | 0.6 /100 | #252 | Tragic 83.9% |