Spanish vs Marshallese In Labor Force | Age 20-24

COMPARE

Spanish
Race
Ancestry
AfghanAfricanAlaska NativeAlaskan AthabascanAlbanianAleutAlsatianAmericanApacheArabArapahoArgentineanArmenianAssyrian/Chaldean/SyriacAustralianAustrianBahamianBangladeshiBarbadianBasqueBelgianBelizeanBermudanBhutaneseBlackfeetBolivianBrazilianBritishBritish West IndianBulgarianBurmeseCajunCambodianCanadianCape VerdeanCarpatho RusynCelticCentral AmericanCentral American IndianCherokeeCheyenneChickasawChileanChineseChippewaChoctawColombianColvilleComancheCosta RicanCreeCreekCroatianCrowCubanCypriotCzechCzechoslovakianDanishDelawareDominicanDutchDutch West IndianEastern EuropeanEcuadorianEgyptianEnglishEstonianEthiopianEuropeanFijianFilipinoFinnishFrenchFrench American IndianFrench CanadianGermanGerman RussianGhanaianGreekGuamanian/ChamorroGuatemalanGuyaneseHaitianHmongHonduranHopiHoumaHungarianIcelanderIndian (Asian)IndonesianInupiatIranianIraqiIrishIroquoisIsraeliItalianJamaicanJapaneseJordanianKenyanKiowaKoreanLaotianLatvianLebaneseLiberianLithuanianLumbeeLuxembourgerMacedonianMalaysianMalteseMenomineeMexicanMexican American IndianMongolianMoroccanNative HawaiianNavajoNepaleseNew ZealanderNicaraguanNigerianNorthern EuropeanNorwegianOkinawanOsageOttawaPaiutePakistaniPalestinianPanamanianParaguayanPennsylvania GermanPeruvianPimaPolishPortuguesePotawatomiPuebloPuerto RicanPuget Sound SalishRomanianRussianSalvadoranSamoanScandinavianScotch-IrishScottishSeminoleSenegaleseSerbianShoshoneSierra LeoneanSiouxSlavicSlovakSloveneSomaliSouth AfricanSouth AmericanSouth American IndianSoviet UnionSpaniardSpanishSpanish AmericanSpanish American IndianSri LankanSubsaharan AfricanSudaneseSwedishSwissSyrianTaiwaneseThaiTlingit-HaidaTohono O'OdhamTonganTrinidadian and TobagonianTsimshianTurkishU.S. Virgin IslanderUgandanUkrainianUruguayanUteVenezuelanVietnameseWelshWest IndianYakamaYaquiYugoslavianYumanYup'ikZimbabwean
Immigration
NonimmigrantsImmigrantsAfghanistanAfricaAlbaniaArgentinaArmeniaAsiaAustraliaAustriaBahamasBangladeshBarbadosBelarusBelgiumBelizeBoliviaBosnia and HerzegovinaBrazilBulgariaBurma/MyanmarCabo VerdeCambodiaCameroonCanadaCaribbeanCentral AmericaChileChinaColombiaCongoCosta RicaCroatiaCubaCzechoslovakiaDenmarkDominicaDominican RepublicEastern AfricaEastern AsiaEastern EuropeEcuadorEgyptEl SalvadorEnglandEritreaEthiopiaEuropeFijiFranceGermanyGhanaGreeceGrenadaGuatemalaGuyanaHaitiHondurasHong KongHungaryIndiaIndonesiaIranIraqIrelandIsraelItalyJamaicaJapanJordanKazakhstanKenyaKoreaKuwaitLaosLatin AmericaLatviaLebanonLiberiaLithuaniaMalaysiaMexicoMicronesiaMiddle AfricaMoldovaMoroccoNepalNetherlandsNicaraguaNigeriaNorth AmericaNorth MacedoniaNorthern AfricaNorthern EuropeNorwayOceaniaPakistanPanamaPeruPhilippinesPolandPortugalRomaniaRussiaSaudi ArabiaScotlandSenegalSerbiaSierra LeoneSingaporeSomaliaSouth AfricaSouth AmericaSouth Central AsiaSouth Eastern AsiaSouthern EuropeSpainSri LankaSt. Vincent and the GrenadinesSudanSwedenSwitzerlandSyriaTaiwanThailandTrinidad and TobagoTurkeyUgandaUkraineUruguayUzbekistanVenezuelaVietnamWest IndiesWestern AfricaWestern AsiaWestern EuropeYemenZaireZimbabweAzores
Marshallese
Race
Ancestry
AfghanAfricanAlaska NativeAlaskan AthabascanAlbanianAleutAlsatianAmericanApacheArabArapahoArgentineanArmenianAssyrian/Chaldean/SyriacAustralianAustrianBahamianBangladeshiBarbadianBasqueBelgianBelizeanBermudanBhutaneseBlackfeetBolivianBrazilianBritishBritish West IndianBulgarianBurmeseCajunCambodianCanadianCape VerdeanCarpatho RusynCelticCentral AmericanCentral American IndianCherokeeCheyenneChickasawChileanChineseChippewaChoctawColombianColvilleComancheCosta RicanCreeCreekCroatianCrowCubanCypriotCzechCzechoslovakianDanishDelawareDominicanDutchDutch West IndianEastern EuropeanEcuadorianEgyptianEnglishEstonianEthiopianEuropeanFijianFilipinoFinnishFrenchFrench American IndianFrench CanadianGermanGerman RussianGhanaianGreekGuamanian/ChamorroGuatemalanGuyaneseHaitianHmongHonduranHopiHoumaHungarianIcelanderIndian (Asian)IndonesianInupiatIranianIraqiIrishIroquoisIsraeliItalianJamaicanJapaneseJordanianKenyanKiowaKoreanLaotianLatvianLebaneseLiberianLithuanianLumbeeLuxembourgerMacedonianMalaysianMalteseMarshalleseMenomineeMexicanMexican American IndianMongolianMoroccanNative HawaiianNavajoNepaleseNew ZealanderNicaraguanNigerianNorthern EuropeanNorwegianOkinawanOsageOttawaPaiutePakistaniPalestinianPanamanianParaguayanPennsylvania GermanPeruvianPimaPolishPortuguesePotawatomiPuebloPuerto RicanPuget Sound SalishRomanianRussianSalvadoranSamoanScandinavianScotch-IrishScottishSeminoleSenegaleseSerbianShoshoneSierra LeoneanSiouxSlavicSlovakSloveneSomaliSouth AfricanSouth AmericanSouth American IndianSoviet UnionSpaniardSpanish AmericanSpanish American IndianSri LankanSubsaharan AfricanSudaneseSwedishSwissSyrianTaiwaneseThaiTlingit-HaidaTohono O'OdhamTonganTrinidadian and TobagonianTsimshianTurkishU.S. Virgin IslanderUgandanUkrainianUruguayanUteVenezuelanVietnameseWelshWest IndianYakamaYaquiYugoslavianYumanYup'ikZimbabwean
Immigration
NonimmigrantsImmigrantsAfghanistanAfricaAlbaniaArgentinaArmeniaAsiaAustraliaAustriaBahamasBangladeshBarbadosBelarusBelgiumBelizeBoliviaBosnia and HerzegovinaBrazilBulgariaBurma/MyanmarCabo VerdeCambodiaCameroonCanadaCaribbeanCentral AmericaChileChinaColombiaCongoCosta RicaCroatiaCubaCzechoslovakiaDenmarkDominicaDominican RepublicEastern AfricaEastern AsiaEastern EuropeEcuadorEgyptEl SalvadorEnglandEritreaEthiopiaEuropeFijiFranceGermanyGhanaGreeceGrenadaGuatemalaGuyanaHaitiHondurasHong KongHungaryIndiaIndonesiaIranIraqIrelandIsraelItalyJamaicaJapanJordanKazakhstanKenyaKoreaKuwaitLaosLatin AmericaLatviaLebanonLiberiaLithuaniaMalaysiaMexicoMicronesiaMiddle AfricaMoldovaMoroccoNepalNetherlandsNicaraguaNigeriaNorth AmericaNorth MacedoniaNorthern AfricaNorthern EuropeNorwayOceaniaPakistanPanamaPeruPhilippinesPolandPortugalRomaniaRussiaSaudi ArabiaScotlandSenegalSerbiaSierra LeoneSingaporeSomaliaSouth AfricaSouth AmericaSouth Central AsiaSouth Eastern AsiaSouthern EuropeSpainSri LankaSt. Vincent and the GrenadinesSudanSwedenSwitzerlandSyriaTaiwanThailandTrinidad and TobagoTurkeyUgandaUkraineUruguayUzbekistanVenezuelaVietnamWest IndiesWestern AfricaWestern AsiaWestern EuropeYemenZaireZimbabweAzores
In Labor Force | Age 20-24
Income
Poverty
Unemployment
Labor Participation
Family Structure
Vehicle Availability
Education Level
Disability

In Labor Force | Age 20-24 Comparison

Spanish

Marshallese

Exceptional
Exceptional
76.4%
IN LABOR FORCE | AGE 20-24
99.2/ 100
METRIC RATING
88th/ 347
METRIC RANK
77.4%
IN LABOR FORCE | AGE 20-24
100.0/ 100
METRIC RATING
38th/ 347
METRIC RANK

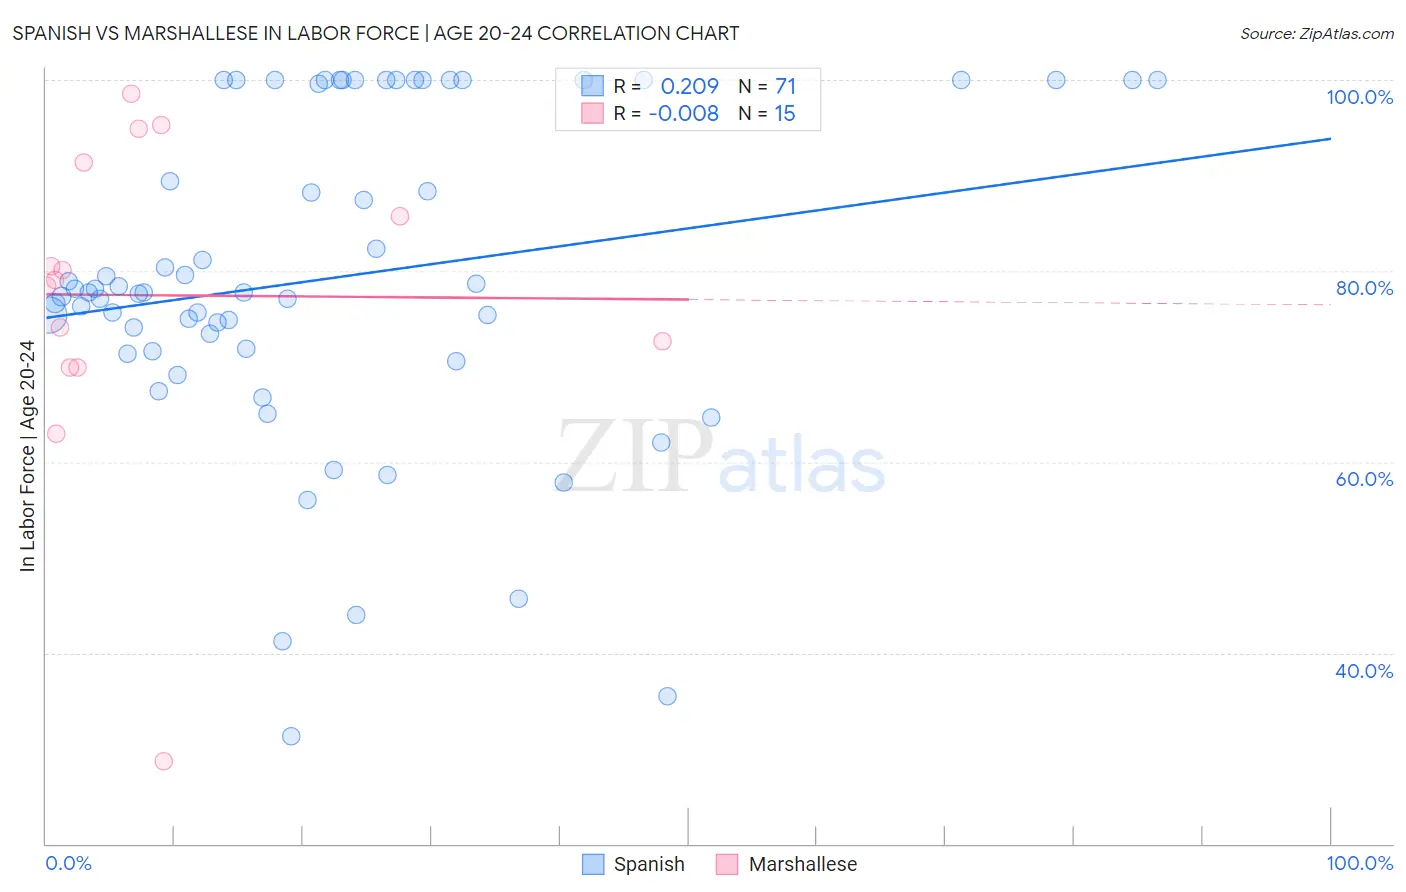
Spanish vs Marshallese In Labor Force | Age 20-24 Correlation Chart

The statistical analysis conducted on geographies consisting of 421,912,033 people shows a weak positive correlation between the proportion of Spanish and labor force participation rate among population between the ages 20 and 24 in the United States with a correlation coefficient (R) of 0.209 and weighted average of 76.4%. Similarly, the statistical analysis conducted on geographies consisting of 14,760,991 people shows no correlation between the proportion of Marshallese and labor force participation rate among population between the ages 20 and 24 in the United States with a correlation coefficient (R) of -0.008 and weighted average of 77.4%, a difference of 1.4%.
Spanish vs Marshallese In Labor Force | Age 20-24

In Labor Force | Age 20-24 Correlation Summary

MeasurementSpanishMarshallese
Minimum31.3%28.6%
Maximum100.0%98.5%
Range68.7%69.9%
Mean79.3%77.5%
Median77.8%79.1%
Interquartile 25% (IQ1)71.6%69.9%
Interquartile 75% (IQ3)100.0%91.3%
Interquartile Range (IQR)28.4%21.4%
Standard Deviation (Sample)17.1%17.1%
Standard Deviation (Population)16.9%16.5%

Similar Demographics by In Labor Force | Age 20-24

Demographics Similar to Spanish by In Labor Force | Age 20-24

In terms of in labor force | age 20-24, the demographic groups most similar to Spanish are Bulgarian (76.4%, a difference of 0.010%), Immigrants from Iraq (76.4%, a difference of 0.050%), Immigrants from Thailand (76.4%, a difference of 0.050%), Immigrants from Burma/Myanmar (76.3%, a difference of 0.050%), and Portuguese (76.4%, a difference of 0.070%).
DemographicsRating | RankIn Labor Force | Age 20-24
Basques
99.5
/100
|
#81
Exceptional
76.5%
Hmong
99.5
/100
|
#82
Exceptional
76.5%
Carpatho Rusyns
99.4
/100
|
#83
Exceptional
76.5%
Austrians
99.4
/100
|
#84
Exceptional
76.5%
Portuguese
99.3
/100
|
#85
Exceptional
76.4%
Immigrants | Iraq
99.3
/100
|
#86
Exceptional
76.4%
Immigrants | Thailand
99.3
/100
|
#87
Exceptional
76.4%
Spanish
99.2
/100
|
#88
Exceptional
76.4%
Bulgarians
99.2
/100
|
#89
Exceptional
76.4%
Immigrants | Burma/Myanmar
99.1
/100
|
#90
Exceptional
76.3%
Sierra Leoneans
99.0
/100
|
#91
Exceptional
76.3%
Maltese
98.9
/100
|
#92
Exceptional
76.3%
Hungarians
98.9
/100
|
#93
Exceptional
76.3%
Potawatomi
98.5
/100
|
#94
Exceptional
76.2%
Immigrants | Germany
98.5
/100
|
#95
Exceptional
76.2%

Demographics Similar to Marshallese by In Labor Force | Age 20-24

In terms of in labor force | age 20-24, the demographic groups most similar to Marshallese are Irish (77.4%, a difference of 0.030%), Czechoslovakian (77.5%, a difference of 0.050%), Scottish (77.4%, a difference of 0.060%), Welsh (77.5%, a difference of 0.070%), and Immigrants from Congo (77.4%, a difference of 0.070%).
DemographicsRating | RankIn Labor Force | Age 20-24
Poles
100.0
/100
|
#31
Exceptional
77.6%
English
100.0
/100
|
#32
Exceptional
77.6%
Immigrants | Ethiopia
100.0
/100
|
#33
Exceptional
77.5%
German Russians
100.0
/100
|
#34
Exceptional
77.5%
Immigrants | Eastern Africa
100.0
/100
|
#35
Exceptional
77.5%
Welsh
100.0
/100
|
#36
Exceptional
77.5%
Czechoslovakians
100.0
/100
|
#37
Exceptional
77.5%
Marshallese
100.0
/100
|
#38
Exceptional
77.4%
Irish
100.0
/100
|
#39
Exceptional
77.4%
Scottish
100.0
/100
|
#40
Exceptional
77.4%
Immigrants | Congo
100.0
/100
|
#41
Exceptional
77.4%
French
100.0
/100
|
#42
Exceptional
77.4%
Immigrants | Laos
100.0
/100
|
#43
Exceptional
77.4%
Fijians
100.0
/100
|
#44
Exceptional
77.4%
Native Hawaiians
100.0
/100
|
#45
Exceptional
77.4%