Spaniard vs Immigrants from El Salvador In Labor Force | Age 45-54
COMPARE
Spaniard
Immigrants from El Salvador
In Labor Force | Age 45-54
In Labor Force | Age 45-54 Comparison
Spaniards
Immigrants from El Salvador
81.5%
IN LABOR FORCE | AGE 45-54
0.1/ 100
METRIC RATING
260th/ 347
METRIC RANK
81.9%
IN LABOR FORCE | AGE 45-54
1.0/ 100
METRIC RATING
240th/ 347
METRIC RANK
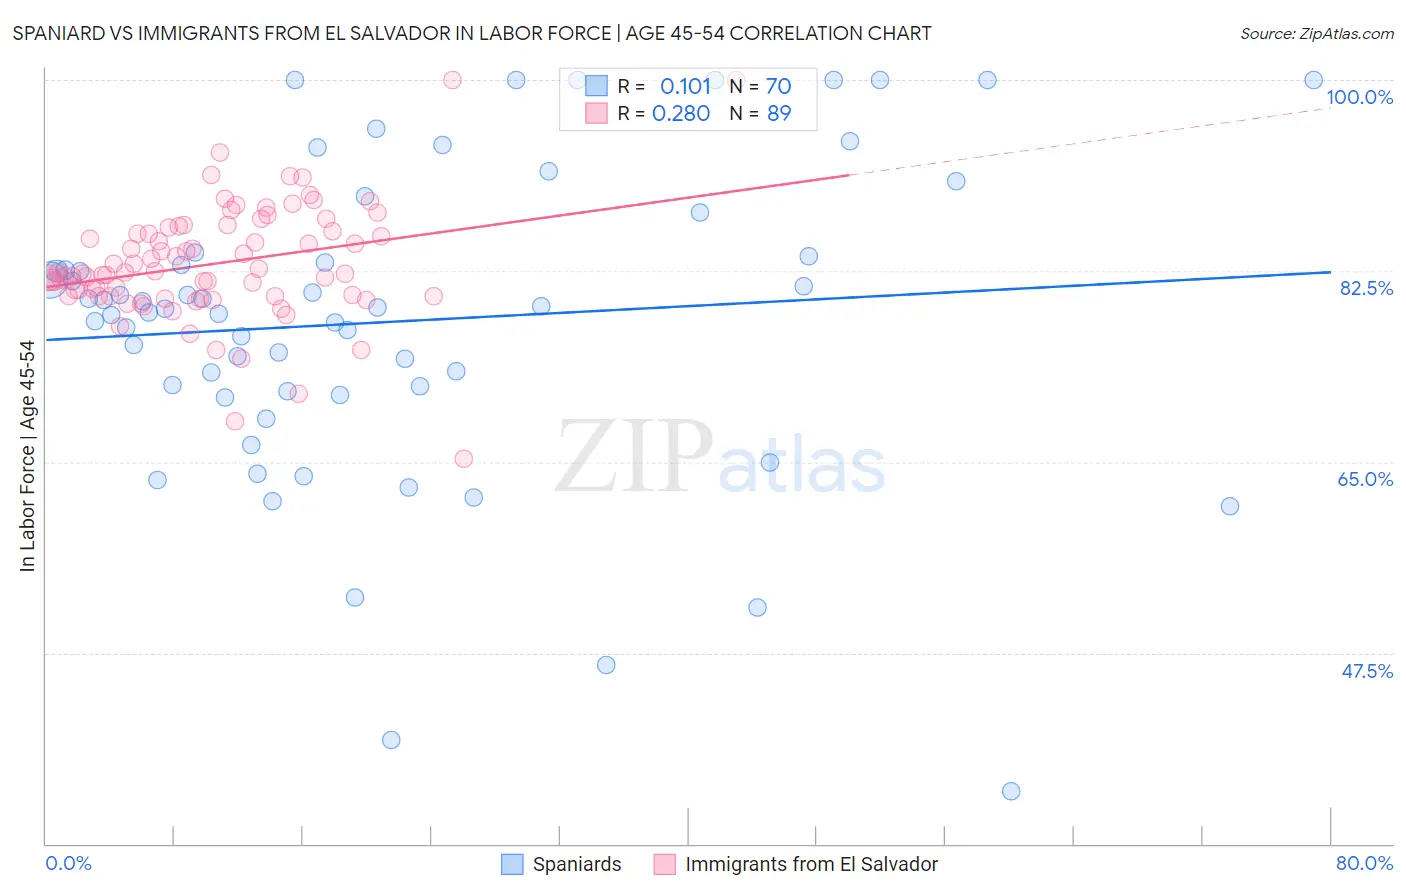
Spaniard vs Immigrants from El Salvador In Labor Force | Age 45-54 Correlation Chart
The statistical analysis conducted on geographies consisting of 443,105,188 people shows a poor positive correlation between the proportion of Spaniards and labor force participation rate among population between the ages 45 and 54 in the United States with a correlation coefficient (R) of 0.101 and weighted average of 81.5%. Similarly, the statistical analysis conducted on geographies consisting of 357,696,462 people shows a weak positive correlation between the proportion of Immigrants from El Salvador and labor force participation rate among population between the ages 45 and 54 in the United States with a correlation coefficient (R) of 0.280 and weighted average of 81.9%, a difference of 0.50%.
In Labor Force | Age 45-54 Correlation Summary
| Measurement | Spaniard | Immigrants from El Salvador |
| Minimum | 34.8% | 65.3% |
| Maximum | 100.0% | 100.0% |
| Range | 65.2% | 34.7% |
| Mean | 77.9% | 83.1% |
| Median | 79.1% | 82.2% |
| Interquartile 25% (IQ1) | 71.5% | 80.2% |
| Interquartile 75% (IQ3) | 83.8% | 86.3% |
| Interquartile Range (IQR) | 12.3% | 6.1% |
| Standard Deviation (Sample) | 14.2% | 5.3% |
| Standard Deviation (Population) | 14.1% | 5.3% |
Demographics Similar to Spaniards and Immigrants from El Salvador by In Labor Force | Age 45-54
In terms of in labor force | age 45-54, the demographic groups most similar to Spaniards are Immigrants from Fiji (81.5%, a difference of 0.030%), Guyanese (81.5%, a difference of 0.030%), Immigrants from Congo (81.6%, a difference of 0.050%), Barbadian (81.6%, a difference of 0.070%), and Scotch-Irish (81.6%, a difference of 0.10%). Similarly, the demographic groups most similar to Immigrants from El Salvador are Immigrants from Cambodia (81.9%, a difference of 0.050%), White/Caucasian (81.9%, a difference of 0.090%), Samoan (81.8%, a difference of 0.090%), Celtic (81.8%, a difference of 0.18%), and Alaska Native (81.8%, a difference of 0.20%).
| Demographics | Rating | Rank | In Labor Force | Age 45-54 |
| Immigrants | El Salvador | 1.0 /100 | #240 | Tragic 81.9% |
| Immigrants | Cambodia | 0.8 /100 | #241 | Tragic 81.9% |
| Whites/Caucasians | 0.7 /100 | #242 | Tragic 81.9% |
| Samoans | 0.6 /100 | #243 | Tragic 81.8% |
| Celtics | 0.4 /100 | #244 | Tragic 81.8% |
| Alaska Natives | 0.4 /100 | #245 | Tragic 81.8% |
| Alaskan Athabascans | 0.4 /100 | #246 | Tragic 81.8% |
| Central Americans | 0.4 /100 | #247 | Tragic 81.7% |
| Puget Sound Salish | 0.3 /100 | #248 | Tragic 81.7% |
| Hmong | 0.3 /100 | #249 | Tragic 81.7% |
| Immigrants | Armenia | 0.2 /100 | #250 | Tragic 81.7% |
| Guamanians/Chamorros | 0.2 /100 | #251 | Tragic 81.6% |
| Pennsylvania Germans | 0.2 /100 | #252 | Tragic 81.6% |
| Japanese | 0.2 /100 | #253 | Tragic 81.6% |
| Immigrants | Laos | 0.2 /100 | #254 | Tragic 81.6% |
| Scotch-Irish | 0.2 /100 | #255 | Tragic 81.6% |
| Barbadians | 0.1 /100 | #256 | Tragic 81.6% |
| Immigrants | Congo | 0.1 /100 | #257 | Tragic 81.6% |
| Immigrants | Fiji | 0.1 /100 | #258 | Tragic 81.5% |
| Guyanese | 0.1 /100 | #259 | Tragic 81.5% |
| Spaniards | 0.1 /100 | #260 | Tragic 81.5% |