Soviet Union vs Osage In Labor Force | Age 25-29

COMPARE

Soviet Union
Race
Ancestry
AfghanAfricanAlaska NativeAlaskan AthabascanAlbanianAleutAlsatianAmericanApacheArabArapahoArgentineanArmenianAssyrian/Chaldean/SyriacAustralianAustrianBahamianBangladeshiBarbadianBasqueBelgianBelizeanBermudanBhutaneseBlackfeetBolivianBrazilianBritishBritish West IndianBulgarianBurmeseCajunCambodianCanadianCape VerdeanCarpatho RusynCelticCentral AmericanCentral American IndianCherokeeCheyenneChickasawChileanChineseChippewaChoctawColombianColvilleComancheCosta RicanCreeCreekCroatianCrowCubanCypriotCzechCzechoslovakianDanishDelawareDominicanDutchDutch West IndianEastern EuropeanEcuadorianEgyptianEnglishEstonianEthiopianEuropeanFijianFilipinoFinnishFrenchFrench American IndianFrench CanadianGermanGerman RussianGhanaianGreekGuamanian/ChamorroGuatemalanGuyaneseHaitianHmongHonduranHopiHoumaHungarianIcelanderIndian (Asian)IndonesianInupiatIranianIraqiIrishIroquoisIsraeliItalianJamaicanJapaneseJordanianKenyanKiowaKoreanLaotianLatvianLebaneseLiberianLithuanianLumbeeLuxembourgerMacedonianMalaysianMalteseMarshalleseMenomineeMexicanMexican American IndianMongolianMoroccanNative HawaiianNavajoNepaleseNew ZealanderNicaraguanNigerianNorthern EuropeanNorwegianOkinawanOttawaPaiutePakistaniPalestinianPanamanianParaguayanPennsylvania GermanPeruvianPimaPolishPortuguesePotawatomiPuebloPuerto RicanPuget Sound SalishRomanianRussianSalvadoranSamoanScandinavianScotch-IrishScottishSeminoleSenegaleseSerbianShoshoneSierra LeoneanSiouxSlavicSlovakSloveneSomaliSouth AfricanSouth AmericanSouth American IndianSoviet UnionSpaniardSpanishSpanish AmericanSpanish American IndianSri LankanSubsaharan AfricanSudaneseSwedishSwissSyrianTaiwaneseThaiTlingit-HaidaTohono O'OdhamTonganTrinidadian and TobagonianTsimshianTurkishU.S. Virgin IslanderUgandanUkrainianUruguayanUteVenezuelanVietnameseWelshWest IndianYakamaYaquiYugoslavianYumanYup'ikZimbabwean
Immigration
NonimmigrantsImmigrantsAfghanistanAfricaAlbaniaArgentinaArmeniaAsiaAustraliaAustriaBahamasBangladeshBarbadosBelarusBelgiumBelizeBoliviaBosnia and HerzegovinaBrazilBulgariaBurma/MyanmarCabo VerdeCambodiaCameroonCanadaCaribbeanCentral AmericaChileChinaColombiaCongoCosta RicaCroatiaCubaCzechoslovakiaDenmarkDominicaDominican RepublicEastern AfricaEastern AsiaEastern EuropeEcuadorEgyptEl SalvadorEnglandEritreaEthiopiaEuropeFijiFranceGermanyGhanaGreeceGrenadaGuatemalaGuyanaHaitiHondurasHong KongHungaryIndiaIndonesiaIranIraqIrelandIsraelItalyJamaicaJapanJordanKazakhstanKenyaKoreaKuwaitLaosLatin AmericaLatviaLebanonLiberiaLithuaniaMalaysiaMexicoMicronesiaMiddle AfricaMoldovaMoroccoNepalNetherlandsNicaraguaNigeriaNorth AmericaNorth MacedoniaNorthern AfricaNorthern EuropeNorwayOceaniaPakistanPanamaPeruPhilippinesPolandPortugalRomaniaRussiaSaudi ArabiaScotlandSenegalSerbiaSierra LeoneSingaporeSomaliaSouth AfricaSouth AmericaSouth Central AsiaSouth Eastern AsiaSouthern EuropeSpainSri LankaSt. Vincent and the GrenadinesSudanSwedenSwitzerlandSyriaTaiwanThailandTrinidad and TobagoTurkeyUgandaUkraineUruguayUzbekistanVenezuelaVietnamWest IndiesWestern AfricaWestern AsiaWestern EuropeYemenZaireZimbabweAzores
Osage
Race
Ancestry
AfghanAfricanAlaska NativeAlaskan AthabascanAlbanianAleutAlsatianAmericanApacheArabArapahoArgentineanArmenianAssyrian/Chaldean/SyriacAustralianAustrianBahamianBangladeshiBarbadianBasqueBelgianBelizeanBermudanBhutaneseBlackfeetBolivianBrazilianBritishBritish West IndianBulgarianBurmeseCajunCambodianCanadianCape VerdeanCarpatho RusynCelticCentral AmericanCentral American IndianCherokeeCheyenneChickasawChileanChineseChippewaChoctawColombianColvilleComancheCosta RicanCreeCreekCroatianCrowCubanCypriotCzechCzechoslovakianDanishDelawareDominicanDutchDutch West IndianEastern EuropeanEcuadorianEgyptianEnglishEstonianEthiopianEuropeanFijianFilipinoFinnishFrenchFrench American IndianFrench CanadianGermanGerman RussianGhanaianGreekGuamanian/ChamorroGuatemalanGuyaneseHaitianHmongHonduranHopiHoumaHungarianIcelanderIndian (Asian)IndonesianInupiatIranianIraqiIrishIroquoisIsraeliItalianJamaicanJapaneseJordanianKenyanKiowaKoreanLaotianLatvianLebaneseLiberianLithuanianLumbeeLuxembourgerMacedonianMalaysianMalteseMarshalleseMenomineeMexicanMexican American IndianMongolianMoroccanNative HawaiianNavajoNepaleseNew ZealanderNicaraguanNigerianNorthern EuropeanNorwegianOkinawanOsageOttawaPaiutePakistaniPalestinianPanamanianParaguayanPennsylvania GermanPeruvianPimaPolishPortuguesePotawatomiPuebloPuerto RicanPuget Sound SalishRomanianRussianSalvadoranSamoanScandinavianScotch-IrishScottishSeminoleSenegaleseSerbianShoshoneSierra LeoneanSiouxSlavicSlovakSloveneSomaliSouth AfricanSouth AmericanSouth American IndianSpaniardSpanishSpanish AmericanSpanish American IndianSri LankanSubsaharan AfricanSudaneseSwedishSwissSyrianTaiwaneseThaiTlingit-HaidaTohono O'OdhamTonganTrinidadian and TobagonianTsimshianTurkishU.S. Virgin IslanderUgandanUkrainianUruguayanUteVenezuelanVietnameseWelshWest IndianYakamaYaquiYugoslavianYumanYup'ikZimbabwean
Immigration
NonimmigrantsImmigrantsAfghanistanAfricaAlbaniaArgentinaArmeniaAsiaAustraliaAustriaBahamasBangladeshBarbadosBelarusBelgiumBelizeBoliviaBosnia and HerzegovinaBrazilBulgariaBurma/MyanmarCabo VerdeCambodiaCameroonCanadaCaribbeanCentral AmericaChileChinaColombiaCongoCosta RicaCroatiaCubaCzechoslovakiaDenmarkDominicaDominican RepublicEastern AfricaEastern AsiaEastern EuropeEcuadorEgyptEl SalvadorEnglandEritreaEthiopiaEuropeFijiFranceGermanyGhanaGreeceGrenadaGuatemalaGuyanaHaitiHondurasHong KongHungaryIndiaIndonesiaIranIraqIrelandIsraelItalyJamaicaJapanJordanKazakhstanKenyaKoreaKuwaitLaosLatin AmericaLatviaLebanonLiberiaLithuaniaMalaysiaMexicoMicronesiaMiddle AfricaMoldovaMoroccoNepalNetherlandsNicaraguaNigeriaNorth AmericaNorth MacedoniaNorthern AfricaNorthern EuropeNorwayOceaniaPakistanPanamaPeruPhilippinesPolandPortugalRomaniaRussiaSaudi ArabiaScotlandSenegalSerbiaSierra LeoneSingaporeSomaliaSouth AfricaSouth AmericaSouth Central AsiaSouth Eastern AsiaSouthern EuropeSpainSri LankaSt. Vincent and the GrenadinesSudanSwedenSwitzerlandSyriaTaiwanThailandTrinidad and TobagoTurkeyUgandaUkraineUruguayUzbekistanVenezuelaVietnamWest IndiesWestern AfricaWestern AsiaWestern EuropeYemenZaireZimbabweAzores
In Labor Force | Age 25-29
Income
Poverty
Unemployment
Labor Participation
Family Structure
Vehicle Availability
Education Level
Disability

In Labor Force | Age 25-29 Comparison

Soviet Union

Osage

Exceptional
Tragic
85.3%
IN LABOR FORCE | AGE 25-29
98.5/ 100
METRIC RATING
74th/ 347
METRIC RANK
82.3%
IN LABOR FORCE | AGE 25-29
0.0/ 100
METRIC RATING
310th/ 347
METRIC RANK

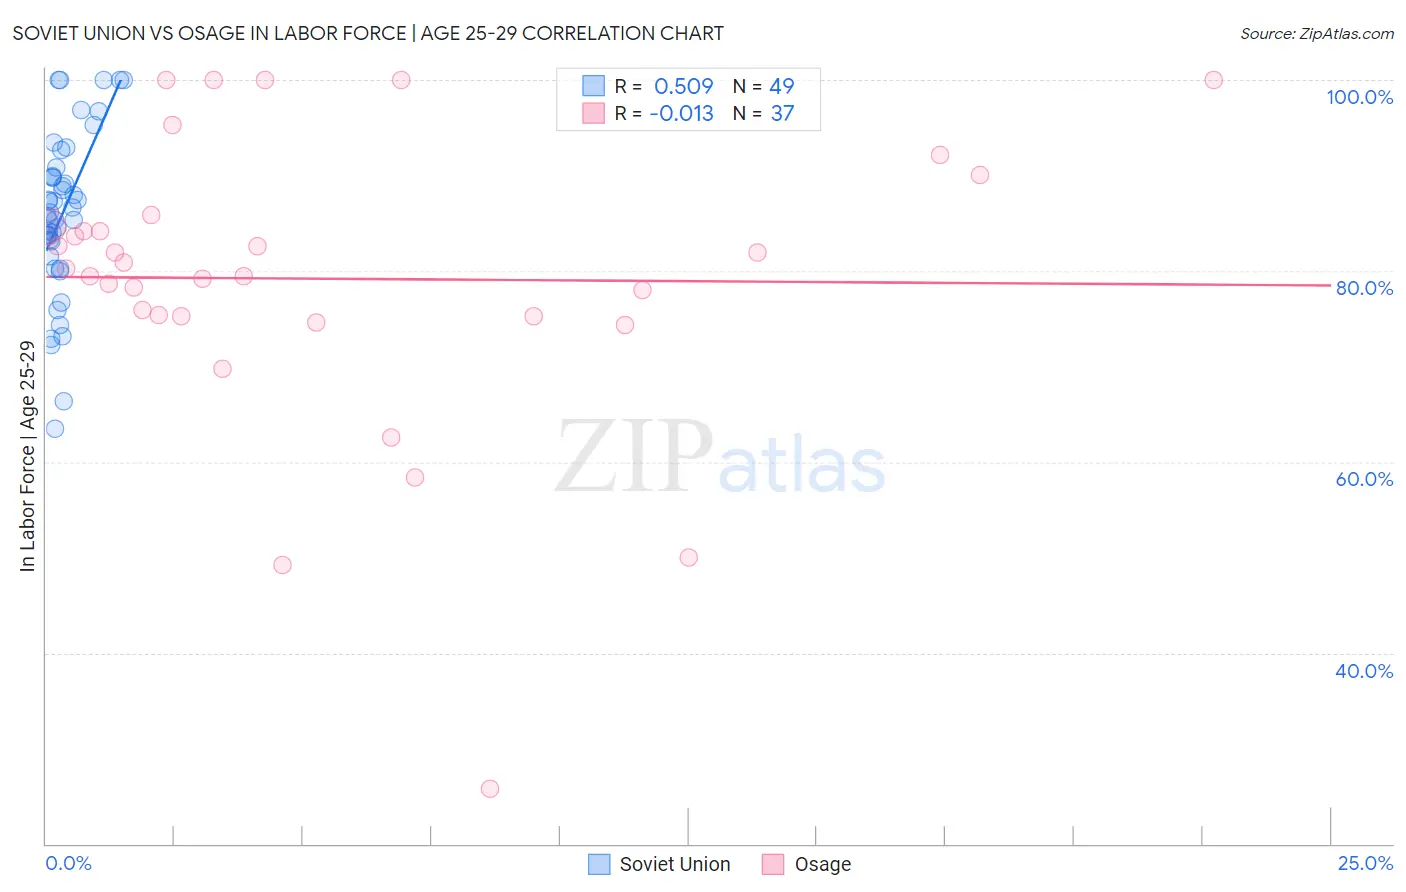
Soviet Union vs Osage In Labor Force | Age 25-29 Correlation Chart

The statistical analysis conducted on geographies consisting of 43,504,224 people shows a substantial positive correlation between the proportion of Soviet Union and labor force participation rate among population between the ages 25 and 29 in the United States with a correlation coefficient (R) of 0.509 and weighted average of 85.3%. Similarly, the statistical analysis conducted on geographies consisting of 91,794,280 people shows no correlation between the proportion of Osage and labor force participation rate among population between the ages 25 and 29 in the United States with a correlation coefficient (R) of -0.013 and weighted average of 82.3%, a difference of 3.7%.
Soviet Union vs Osage In Labor Force | Age 25-29

In Labor Force | Age 25-29 Correlation Summary

MeasurementSoviet UnionOsage
Minimum63.5%25.7%
Maximum100.0%100.0%
Range36.5%74.3%
Mean86.0%79.2%
Median86.1%80.2%
Interquartile 25% (IQ1)82.3%75.3%
Interquartile 75% (IQ3)90.3%85.2%
Interquartile Range (IQR)8.0%9.9%
Standard Deviation (Sample)8.5%15.3%
Standard Deviation (Population)8.4%15.1%

Similar Demographics by In Labor Force | Age 25-29

Demographics Similar to Soviet Union by In Labor Force | Age 25-29

In terms of in labor force | age 25-29, the demographic groups most similar to Soviet Union are Brazilian (85.3%, a difference of 0.030%), Russian (85.3%, a difference of 0.040%), Immigrants from Australia (85.3%, a difference of 0.050%), German (85.3%, a difference of 0.050%), and Kenyan (85.4%, a difference of 0.070%).
DemographicsRating | RankIn Labor Force | Age 25-29
Immigrants | Turkey
99.2
/100
|
#67
Exceptional
85.4%
Immigrants | Cameroon
99.2
/100
|
#68
Exceptional
85.4%
Menominee
99.1
/100
|
#69
Exceptional
85.4%
Immigrants | Sweden
99.1
/100
|
#70
Exceptional
85.4%
Kenyans
99.0
/100
|
#71
Exceptional
85.4%
Immigrants | Australia
98.9
/100
|
#72
Exceptional
85.3%
Russians
98.8
/100
|
#73
Exceptional
85.3%
Soviet Union
98.5
/100
|
#74
Exceptional
85.3%
Brazilians
98.3
/100
|
#75
Exceptional
85.3%
Germans
98.1
/100
|
#76
Exceptional
85.3%
Immigrants | South Central Asia
97.9
/100
|
#77
Exceptional
85.2%
Immigrants | Egypt
97.7
/100
|
#78
Exceptional
85.2%
Immigrants | Northern Africa
97.6
/100
|
#79
Exceptional
85.2%
Immigrants | Zimbabwe
97.6
/100
|
#80
Exceptional
85.2%
Immigrants | Northern Europe
97.2
/100
|
#81
Exceptional
85.2%

Demographics Similar to Osage by In Labor Force | Age 25-29

In terms of in labor force | age 25-29, the demographic groups most similar to Osage are Alaskan Athabascan (82.3%, a difference of 0.010%), Hispanic or Latino (82.2%, a difference of 0.080%), Immigrants from Central America (82.4%, a difference of 0.14%), Central American Indian (82.4%, a difference of 0.15%), and Yaqui (82.2%, a difference of 0.17%).
DemographicsRating | RankIn Labor Force | Age 25-29
Immigrants | Grenada
0.0
/100
|
#303
Tragic
82.8%
Immigrants | St. Vincent and the Grenadines
0.0
/100
|
#304
Tragic
82.7%
Blacks/African Americans
0.0
/100
|
#305
Tragic
82.6%
Blackfeet
0.0
/100
|
#306
Tragic
82.6%
Cajuns
0.0
/100
|
#307
Tragic
82.5%
Central American Indians
0.0
/100
|
#308
Tragic
82.4%
Immigrants | Central America
0.0
/100
|
#309
Tragic
82.4%
Osage
0.0
/100
|
#310
Tragic
82.3%
Alaskan Athabascans
0.0
/100
|
#311
Tragic
82.3%
Hispanics or Latinos
0.0
/100
|
#312
Tragic
82.2%
Yaqui
0.0
/100
|
#313
Tragic
82.2%
Cherokee
0.0
/100
|
#314
Tragic
82.1%
Immigrants | Mexico
0.0
/100
|
#315
Tragic
82.0%
Mexicans
0.0
/100
|
#316
Tragic
81.9%
Chickasaw
0.0
/100
|
#317
Tragic
81.9%