Slovak vs Immigrants from India In Labor Force | Age 30-34

COMPARE

Slovak
Race
Ancestry
AfghanAfricanAlaska NativeAlaskan AthabascanAlbanianAleutAlsatianAmericanApacheArabArapahoArgentineanArmenianAssyrian/Chaldean/SyriacAustralianAustrianBahamianBangladeshiBarbadianBasqueBelgianBelizeanBermudanBhutaneseBlackfeetBolivianBrazilianBritishBritish West IndianBulgarianBurmeseCajunCambodianCanadianCape VerdeanCarpatho RusynCelticCentral AmericanCentral American IndianCherokeeCheyenneChickasawChileanChineseChippewaChoctawColombianColvilleComancheCosta RicanCreeCreekCroatianCrowCubanCypriotCzechCzechoslovakianDanishDelawareDominicanDutchDutch West IndianEastern EuropeanEcuadorianEgyptianEnglishEstonianEthiopianEuropeanFijianFilipinoFinnishFrenchFrench American IndianFrench CanadianGermanGerman RussianGhanaianGreekGuamanian/ChamorroGuatemalanGuyaneseHaitianHmongHonduranHopiHoumaHungarianIcelanderIndian (Asian)IndonesianInupiatIranianIraqiIrishIroquoisIsraeliItalianJamaicanJapaneseJordanianKenyanKiowaKoreanLaotianLatvianLebaneseLiberianLithuanianLumbeeLuxembourgerMacedonianMalaysianMalteseMarshalleseMenomineeMexicanMexican American IndianMongolianMoroccanNative HawaiianNavajoNepaleseNew ZealanderNicaraguanNigerianNorthern EuropeanNorwegianOkinawanOsageOttawaPaiutePakistaniPalestinianPanamanianParaguayanPennsylvania GermanPeruvianPimaPolishPortuguesePotawatomiPuebloPuerto RicanPuget Sound SalishRomanianRussianSalvadoranSamoanScandinavianScotch-IrishScottishSeminoleSenegaleseSerbianShoshoneSierra LeoneanSiouxSlavicSlovakSloveneSomaliSouth AfricanSouth AmericanSouth American IndianSoviet UnionSpaniardSpanishSpanish AmericanSpanish American IndianSri LankanSubsaharan AfricanSudaneseSwedishSwissSyrianTaiwaneseThaiTlingit-HaidaTohono O'OdhamTonganTrinidadian and TobagonianTsimshianTurkishU.S. Virgin IslanderUgandanUkrainianUruguayanUteVenezuelanVietnameseWelshWest IndianYakamaYaquiYugoslavianYumanYup'ikZimbabwean
Immigration
NonimmigrantsImmigrantsAfghanistanAfricaAlbaniaArgentinaArmeniaAsiaAustraliaAustriaBahamasBangladeshBarbadosBelarusBelgiumBelizeBoliviaBosnia and HerzegovinaBrazilBulgariaBurma/MyanmarCabo VerdeCambodiaCameroonCanadaCaribbeanCentral AmericaChileChinaColombiaCongoCosta RicaCroatiaCubaCzechoslovakiaDenmarkDominicaDominican RepublicEastern AfricaEastern AsiaEastern EuropeEcuadorEgyptEl SalvadorEnglandEritreaEthiopiaEuropeFijiFranceGermanyGhanaGreeceGrenadaGuatemalaGuyanaHaitiHondurasHong KongHungaryIndonesiaIranIraqIrelandIsraelItalyJamaicaJapanJordanKazakhstanKenyaKoreaKuwaitLaosLatin AmericaLatviaLebanonLiberiaLithuaniaMalaysiaMexicoMicronesiaMiddle AfricaMoldovaMoroccoNepalNetherlandsNicaraguaNigeriaNorth AmericaNorth MacedoniaNorthern AfricaNorthern EuropeNorwayOceaniaPakistanPanamaPeruPhilippinesPolandPortugalRomaniaRussiaSaudi ArabiaScotlandSenegalSerbiaSierra LeoneSingaporeSomaliaSouth AfricaSouth AmericaSouth Central AsiaSouth Eastern AsiaSouthern EuropeSpainSri LankaSt. Vincent and the GrenadinesSudanSwedenSwitzerlandSyriaTaiwanThailandTrinidad and TobagoTurkeyUgandaUkraineUruguayUzbekistanVenezuelaVietnamWest IndiesWestern AfricaWestern AsiaWestern EuropeYemenZaireZimbabweAzores
Immigrants from India
Race
Ancestry
AfghanAfricanAlaska NativeAlaskan AthabascanAlbanianAleutAlsatianAmericanApacheArabArapahoArgentineanArmenianAssyrian/Chaldean/SyriacAustralianAustrianBahamianBangladeshiBarbadianBasqueBelgianBelizeanBermudanBhutaneseBlackfeetBolivianBrazilianBritishBritish West IndianBulgarianBurmeseCajunCambodianCanadianCape VerdeanCarpatho RusynCelticCentral AmericanCentral American IndianCherokeeCheyenneChickasawChileanChineseChippewaChoctawColombianColvilleComancheCosta RicanCreeCreekCroatianCrowCubanCypriotCzechCzechoslovakianDanishDelawareDominicanDutchDutch West IndianEastern EuropeanEcuadorianEgyptianEnglishEstonianEthiopianEuropeanFijianFilipinoFinnishFrenchFrench American IndianFrench CanadianGermanGerman RussianGhanaianGreekGuamanian/ChamorroGuatemalanGuyaneseHaitianHmongHonduranHopiHoumaHungarianIcelanderIndian (Asian)IndonesianInupiatIranianIraqiIrishIroquoisIsraeliItalianJamaicanJapaneseJordanianKenyanKiowaKoreanLaotianLatvianLebaneseLiberianLithuanianLumbeeLuxembourgerMacedonianMalaysianMalteseMarshalleseMenomineeMexicanMexican American IndianMongolianMoroccanNative HawaiianNavajoNepaleseNew ZealanderNicaraguanNigerianNorthern EuropeanNorwegianOkinawanOsageOttawaPaiutePakistaniPalestinianPanamanianParaguayanPennsylvania GermanPeruvianPimaPolishPortuguesePotawatomiPuebloPuerto RicanPuget Sound SalishRomanianRussianSalvadoranSamoanScandinavianScotch-IrishScottishSeminoleSenegaleseSerbianShoshoneSierra LeoneanSiouxSlavicSloveneSomaliSouth AfricanSouth AmericanSouth American IndianSoviet UnionSpaniardSpanishSpanish AmericanSpanish American IndianSri LankanSubsaharan AfricanSudaneseSwedishSwissSyrianTaiwaneseThaiTlingit-HaidaTohono O'OdhamTonganTrinidadian and TobagonianTsimshianTurkishU.S. Virgin IslanderUgandanUkrainianUruguayanUteVenezuelanVietnameseWelshWest IndianYakamaYaquiYugoslavianYumanYup'ikZimbabwean
Immigration
NonimmigrantsImmigrantsAfghanistanAfricaAlbaniaArgentinaArmeniaAsiaAustraliaAustriaBahamasBangladeshBarbadosBelarusBelgiumBelizeBoliviaBosnia and HerzegovinaBrazilBulgariaBurma/MyanmarCabo VerdeCambodiaCameroonCanadaCaribbeanCentral AmericaChileChinaColombiaCongoCosta RicaCroatiaCubaCzechoslovakiaDenmarkDominicaDominican RepublicEastern AfricaEastern AsiaEastern EuropeEcuadorEgyptEl SalvadorEnglandEritreaEthiopiaEuropeFijiFranceGermanyGhanaGreeceGrenadaGuatemalaGuyanaHaitiHondurasHong KongHungaryIndiaIndonesiaIranIraqIrelandIsraelItalyJamaicaJapanJordanKazakhstanKenyaKoreaKuwaitLaosLatin AmericaLatviaLebanonLiberiaLithuaniaMalaysiaMexicoMicronesiaMiddle AfricaMoldovaMoroccoNepalNetherlandsNicaraguaNigeriaNorth AmericaNorth MacedoniaNorthern AfricaNorthern EuropeNorwayOceaniaPakistanPanamaPeruPhilippinesPolandPortugalRomaniaRussiaSaudi ArabiaScotlandSenegalSerbiaSierra LeoneSingaporeSomaliaSouth AfricaSouth AmericaSouth Central AsiaSouth Eastern AsiaSouthern EuropeSpainSri LankaSt. Vincent and the GrenadinesSudanSwedenSwitzerlandSyriaTaiwanThailandTrinidad and TobagoTurkeyUgandaUkraineUruguayUzbekistanVenezuelaVietnamWest IndiesWestern AfricaWestern AsiaWestern EuropeYemenZaireZimbabweAzores
In Labor Force | Age 30-34
Income
Poverty
Unemployment
Labor Participation
Family Structure
Vehicle Availability
Education Level
Disability

In Labor Force | Age 30-34 Comparison

Slovaks

Immigrants from India

Exceptional
Exceptional
85.3%
IN LABOR FORCE | AGE 30-34
98.7/ 100
METRIC RATING
81st/ 347
METRIC RANK
85.2%
IN LABOR FORCE | AGE 30-34
97.4/ 100
METRIC RATING
95th/ 347
METRIC RANK

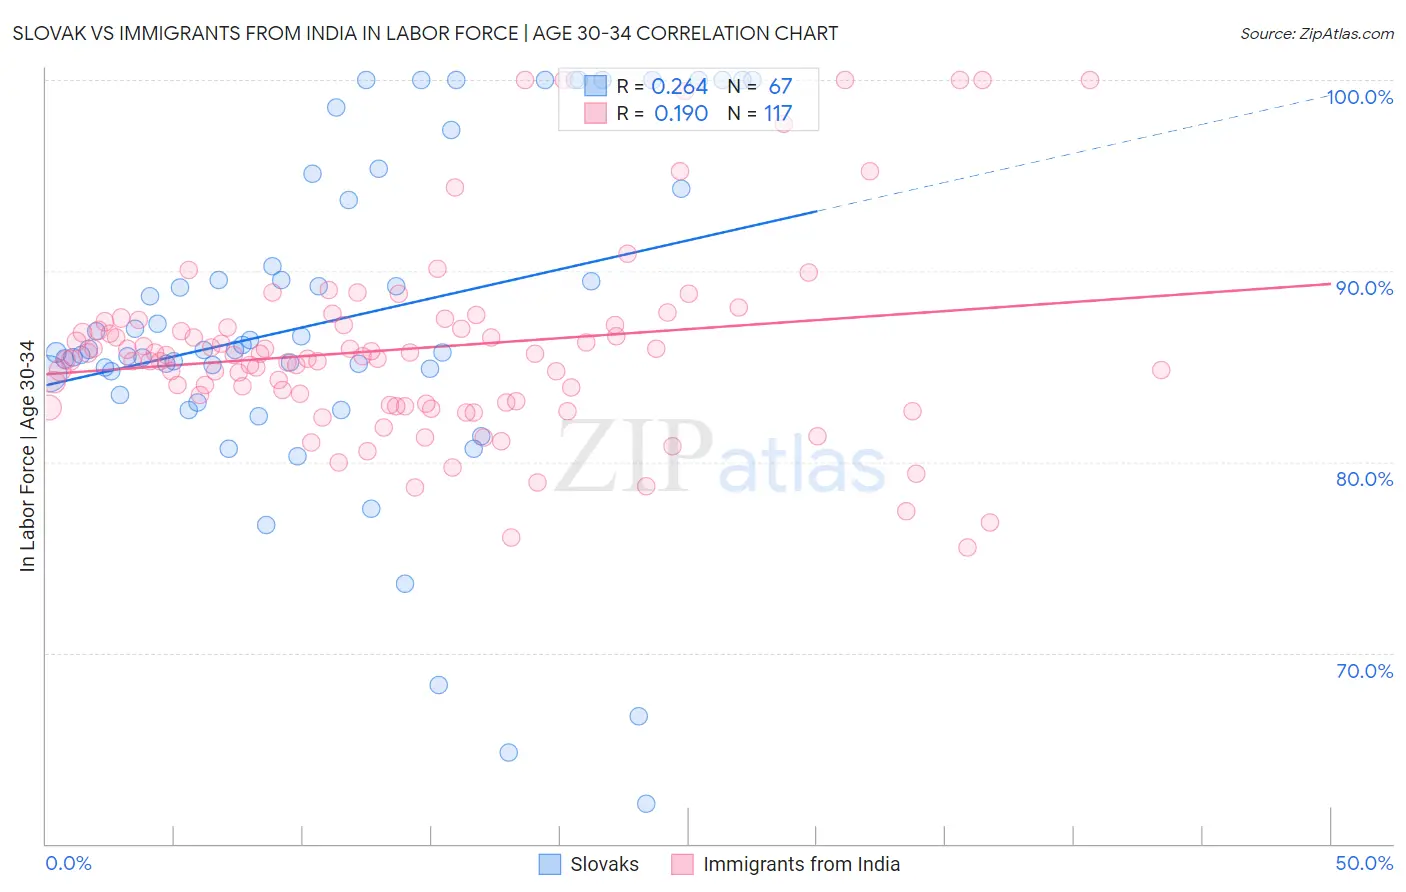
Slovak vs Immigrants from India In Labor Force | Age 30-34 Correlation Chart

The statistical analysis conducted on geographies consisting of 397,592,817 people shows a weak positive correlation between the proportion of Slovaks and labor force participation rate among population between the ages 30 and 34 in the United States with a correlation coefficient (R) of 0.264 and weighted average of 85.3%. Similarly, the statistical analysis conducted on geographies consisting of 433,763,209 people shows a poor positive correlation between the proportion of Immigrants from India and labor force participation rate among population between the ages 30 and 34 in the United States with a correlation coefficient (R) of 0.190 and weighted average of 85.2%, a difference of 0.12%.
Slovak vs Immigrants from India In Labor Force | Age 30-34

In Labor Force | Age 30-34 Correlation Summary

MeasurementSlovakImmigrants from India
Minimum62.1%75.5%
Maximum100.0%100.0%
Range37.9%24.5%
Mean87.4%85.9%
Median85.8%85.5%
Interquartile 25% (IQ1)84.6%83.1%
Interquartile 75% (IQ3)94.3%87.2%
Interquartile Range (IQR)9.7%4.1%
Standard Deviation (Sample)8.8%5.0%
Standard Deviation (Population)8.7%5.0%

Demographics Similar to Slovaks and Immigrants from India by In Labor Force | Age 30-34

In terms of in labor force | age 30-34, the demographic groups most similar to Slovaks are Immigrants from Switzerland (85.3%, a difference of 0.010%), Immigrants from Russia (85.3%, a difference of 0.010%), Immigrants from Africa (85.3%, a difference of 0.010%), Immigrants from Europe (85.3%, a difference of 0.010%), and Greek (85.3%, a difference of 0.010%). Similarly, the demographic groups most similar to Immigrants from India are Swedish (85.2%, a difference of 0.0%), Immigrants from Norway (85.2%, a difference of 0.010%), Immigrants from Korea (85.2%, a difference of 0.010%), Thai (85.2%, a difference of 0.010%), and German Russian (85.2%, a difference of 0.020%).
DemographicsRating | RankIn Labor Force | Age 30-34
Immigrants | Singapore
98.8
/100
|
#78
Exceptional
85.3%
Immigrants | Switzerland
98.7
/100
|
#79
Exceptional
85.3%
Immigrants | Russia
98.7
/100
|
#80
Exceptional
85.3%
Slovaks
98.7
/100
|
#81
Exceptional
85.3%
Immigrants | Africa
98.6
/100
|
#82
Exceptional
85.3%
Immigrants | Europe
98.6
/100
|
#83
Exceptional
85.3%
Greeks
98.6
/100
|
#84
Exceptional
85.3%
Mongolians
98.5
/100
|
#85
Exceptional
85.3%
Immigrants | Taiwan
98.3
/100
|
#86
Exceptional
85.3%
Immigrants | Northern Europe
98.2
/100
|
#87
Exceptional
85.3%
Immigrants | Belgium
98.2
/100
|
#88
Exceptional
85.3%
Immigrants | Kazakhstan
98.1
/100
|
#89
Exceptional
85.3%
Burmese
97.9
/100
|
#90
Exceptional
85.3%
Immigrants | Moldova
97.9
/100
|
#91
Exceptional
85.3%
German Russians
97.7
/100
|
#92
Exceptional
85.2%
Immigrants | Norway
97.6
/100
|
#93
Exceptional
85.2%
Swedes
97.5
/100
|
#94
Exceptional
85.2%
Immigrants | India
97.4
/100
|
#95
Exceptional
85.2%
Immigrants | Korea
97.3
/100
|
#96
Exceptional
85.2%
Thais
97.2
/100
|
#97
Exceptional
85.2%
Immigrants | Uganda
97.2
/100
|
#98
Exceptional
85.2%