Serbian vs Immigrants from Pakistan In Labor Force | Age 16-19

COMPARE

Serbian
Race
Ancestry
AfghanAfricanAlaska NativeAlaskan AthabascanAlbanianAleutAlsatianAmericanApacheArabArapahoArgentineanArmenianAssyrian/Chaldean/SyriacAustralianAustrianBahamianBangladeshiBarbadianBasqueBelgianBelizeanBermudanBhutaneseBlackfeetBolivianBrazilianBritishBritish West IndianBulgarianBurmeseCajunCambodianCanadianCape VerdeanCarpatho RusynCelticCentral AmericanCentral American IndianCherokeeCheyenneChickasawChileanChineseChippewaChoctawColombianColvilleComancheCosta RicanCreeCreekCroatianCrowCubanCypriotCzechCzechoslovakianDanishDelawareDominicanDutchDutch West IndianEastern EuropeanEcuadorianEgyptianEnglishEstonianEthiopianEuropeanFijianFilipinoFinnishFrenchFrench American IndianFrench CanadianGermanGerman RussianGhanaianGreekGuamanian/ChamorroGuatemalanGuyaneseHaitianHmongHonduranHopiHoumaHungarianIcelanderIndian (Asian)IndonesianInupiatIranianIraqiIrishIroquoisIsraeliItalianJamaicanJapaneseJordanianKenyanKiowaKoreanLaotianLatvianLebaneseLiberianLithuanianLumbeeLuxembourgerMacedonianMalaysianMalteseMarshalleseMenomineeMexicanMexican American IndianMongolianMoroccanNative HawaiianNavajoNepaleseNew ZealanderNicaraguanNigerianNorthern EuropeanNorwegianOkinawanOsageOttawaPaiutePakistaniPalestinianPanamanianParaguayanPennsylvania GermanPeruvianPimaPolishPortuguesePotawatomiPuebloPuerto RicanPuget Sound SalishRomanianRussianSalvadoranSamoanScandinavianScotch-IrishScottishSeminoleSenegaleseSerbianShoshoneSierra LeoneanSiouxSlavicSlovakSloveneSomaliSouth AfricanSouth AmericanSouth American IndianSoviet UnionSpaniardSpanishSpanish AmericanSpanish American IndianSri LankanSubsaharan AfricanSudaneseSwedishSwissSyrianTaiwaneseThaiTlingit-HaidaTohono O'OdhamTonganTrinidadian and TobagonianTsimshianTurkishU.S. Virgin IslanderUgandanUkrainianUruguayanUteVenezuelanVietnameseWelshWest IndianYakamaYaquiYugoslavianYumanYup'ikZimbabwean
Immigration
NonimmigrantsImmigrantsAfghanistanAfricaAlbaniaArgentinaArmeniaAsiaAustraliaAustriaBahamasBangladeshBarbadosBelarusBelgiumBelizeBoliviaBosnia and HerzegovinaBrazilBulgariaBurma/MyanmarCabo VerdeCambodiaCameroonCanadaCaribbeanCentral AmericaChileChinaColombiaCongoCosta RicaCroatiaCubaCzechoslovakiaDenmarkDominicaDominican RepublicEastern AfricaEastern AsiaEastern EuropeEcuadorEgyptEl SalvadorEnglandEritreaEthiopiaEuropeFijiFranceGermanyGhanaGreeceGrenadaGuatemalaGuyanaHaitiHondurasHong KongHungaryIndiaIndonesiaIranIraqIrelandIsraelItalyJamaicaJapanJordanKazakhstanKenyaKoreaKuwaitLaosLatin AmericaLatviaLebanonLiberiaLithuaniaMalaysiaMexicoMicronesiaMiddle AfricaMoldovaMoroccoNepalNetherlandsNicaraguaNigeriaNorth AmericaNorth MacedoniaNorthern AfricaNorthern EuropeNorwayOceaniaPanamaPeruPhilippinesPolandPortugalRomaniaRussiaSaudi ArabiaScotlandSenegalSerbiaSierra LeoneSingaporeSomaliaSouth AfricaSouth AmericaSouth Central AsiaSouth Eastern AsiaSouthern EuropeSpainSri LankaSt. Vincent and the GrenadinesSudanSwedenSwitzerlandSyriaTaiwanThailandTrinidad and TobagoTurkeyUgandaUkraineUruguayUzbekistanVenezuelaVietnamWest IndiesWestern AfricaWestern AsiaWestern EuropeYemenZaireZimbabweAzores
Immigrants from Pakistan
Race
Ancestry
AfghanAfricanAlaska NativeAlaskan AthabascanAlbanianAleutAlsatianAmericanApacheArabArapahoArgentineanArmenianAssyrian/Chaldean/SyriacAustralianAustrianBahamianBangladeshiBarbadianBasqueBelgianBelizeanBermudanBhutaneseBlackfeetBolivianBrazilianBritishBritish West IndianBulgarianBurmeseCajunCambodianCanadianCape VerdeanCarpatho RusynCelticCentral AmericanCentral American IndianCherokeeCheyenneChickasawChileanChineseChippewaChoctawColombianColvilleComancheCosta RicanCreeCreekCroatianCrowCubanCypriotCzechCzechoslovakianDanishDelawareDominicanDutchDutch West IndianEastern EuropeanEcuadorianEgyptianEnglishEstonianEthiopianEuropeanFijianFilipinoFinnishFrenchFrench American IndianFrench CanadianGermanGerman RussianGhanaianGreekGuamanian/ChamorroGuatemalanGuyaneseHaitianHmongHonduranHopiHoumaHungarianIcelanderIndian (Asian)IndonesianInupiatIranianIraqiIrishIroquoisIsraeliItalianJamaicanJapaneseJordanianKenyanKiowaKoreanLaotianLatvianLebaneseLiberianLithuanianLumbeeLuxembourgerMacedonianMalaysianMalteseMarshalleseMenomineeMexicanMexican American IndianMongolianMoroccanNative HawaiianNavajoNepaleseNew ZealanderNicaraguanNigerianNorthern EuropeanNorwegianOkinawanOsageOttawaPaiutePakistaniPalestinianPanamanianParaguayanPennsylvania GermanPeruvianPimaPolishPortuguesePotawatomiPuebloPuerto RicanPuget Sound SalishRomanianRussianSalvadoranSamoanScandinavianScotch-IrishScottishSeminoleSenegaleseShoshoneSierra LeoneanSiouxSlavicSlovakSloveneSomaliSouth AfricanSouth AmericanSouth American IndianSoviet UnionSpaniardSpanishSpanish AmericanSpanish American IndianSri LankanSubsaharan AfricanSudaneseSwedishSwissSyrianTaiwaneseThaiTlingit-HaidaTohono O'OdhamTonganTrinidadian and TobagonianTsimshianTurkishU.S. Virgin IslanderUgandanUkrainianUruguayanUteVenezuelanVietnameseWelshWest IndianYakamaYaquiYugoslavianYumanYup'ikZimbabwean
Immigration
NonimmigrantsImmigrantsAfghanistanAfricaAlbaniaArgentinaArmeniaAsiaAustraliaAustriaBahamasBangladeshBarbadosBelarusBelgiumBelizeBoliviaBosnia and HerzegovinaBrazilBulgariaBurma/MyanmarCabo VerdeCambodiaCameroonCanadaCaribbeanCentral AmericaChileChinaColombiaCongoCosta RicaCroatiaCubaCzechoslovakiaDenmarkDominicaDominican RepublicEastern AfricaEastern AsiaEastern EuropeEcuadorEgyptEl SalvadorEnglandEritreaEthiopiaEuropeFijiFranceGermanyGhanaGreeceGrenadaGuatemalaGuyanaHaitiHondurasHong KongHungaryIndiaIndonesiaIranIraqIrelandIsraelItalyJamaicaJapanJordanKazakhstanKenyaKoreaKuwaitLaosLatin AmericaLatviaLebanonLiberiaLithuaniaMalaysiaMexicoMicronesiaMiddle AfricaMoldovaMoroccoNepalNetherlandsNicaraguaNigeriaNorth AmericaNorth MacedoniaNorthern AfricaNorthern EuropeNorwayOceaniaPakistanPanamaPeruPhilippinesPolandPortugalRomaniaRussiaSaudi ArabiaScotlandSenegalSerbiaSierra LeoneSingaporeSomaliaSouth AfricaSouth AmericaSouth Central AsiaSouth Eastern AsiaSouthern EuropeSpainSri LankaSt. Vincent and the GrenadinesSudanSwedenSwitzerlandSyriaTaiwanThailandTrinidad and TobagoTurkeyUgandaUkraineUruguayUzbekistanVenezuelaVietnamWest IndiesWestern AfricaWestern AsiaWestern EuropeYemenZaireZimbabweAzores
In Labor Force | Age 16-19
Income
Poverty
Unemployment
Labor Participation
Family Structure
Vehicle Availability
Education Level
Disability

In Labor Force | Age 16-19 Comparison

Serbians

Immigrants from Pakistan

Exceptional
Tragic
39.9%
IN LABOR FORCE | AGE 16-19
99.9/ 100
METRIC RATING
71st/ 347
METRIC RANK
34.8%
IN LABOR FORCE | AGE 16-19
2.0/ 100
METRIC RATING
250th/ 347
METRIC RANK

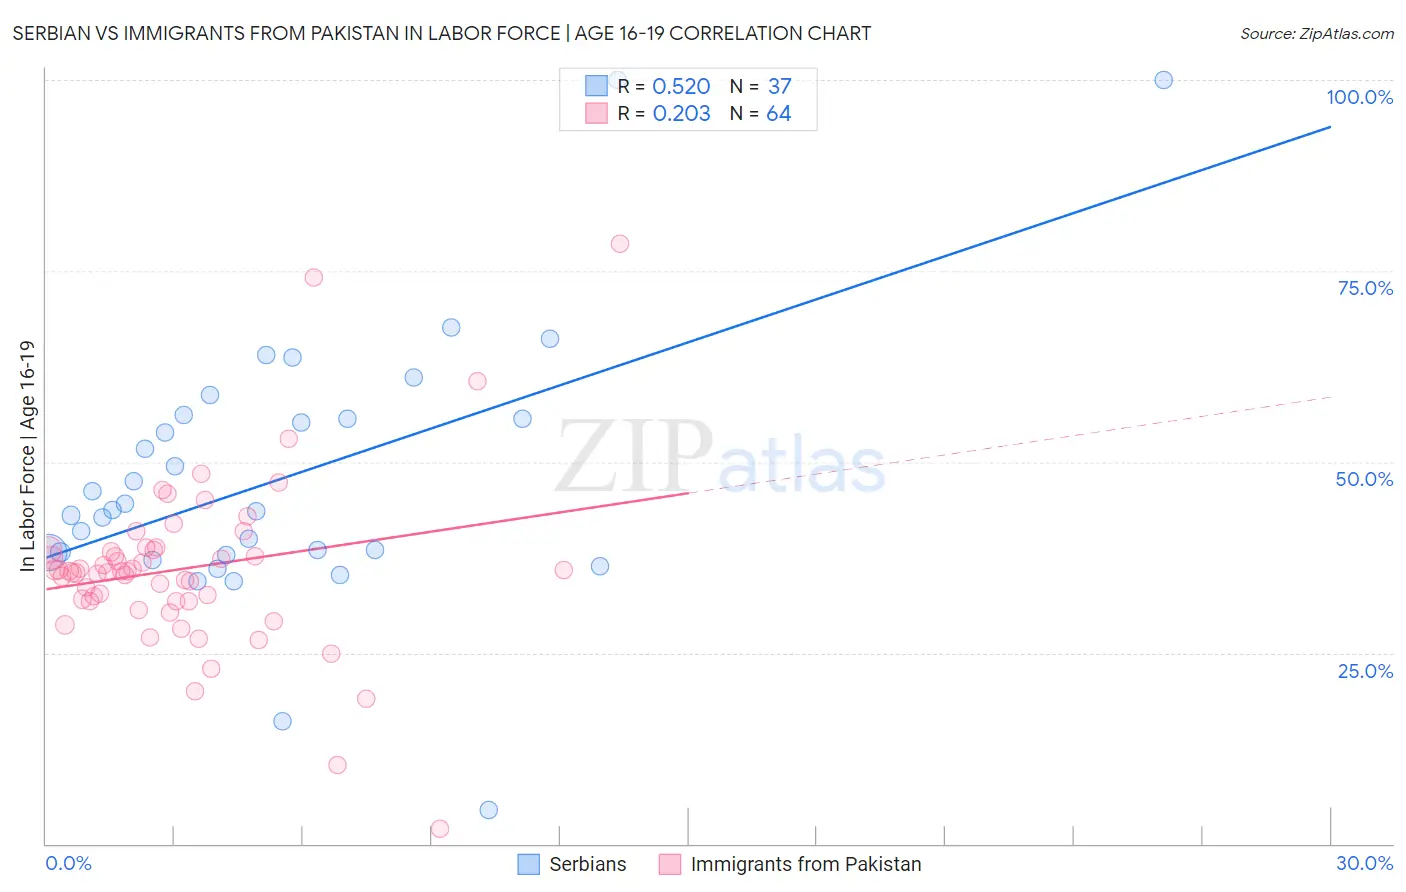
Serbian vs Immigrants from Pakistan In Labor Force | Age 16-19 Correlation Chart

The statistical analysis conducted on geographies consisting of 267,337,384 people shows a substantial positive correlation between the proportion of Serbians and labor force participation rate among population between the ages 16 and 19 in the United States with a correlation coefficient (R) of 0.520 and weighted average of 39.9%. Similarly, the statistical analysis conducted on geographies consisting of 283,687,776 people shows a weak positive correlation between the proportion of Immigrants from Pakistan and labor force participation rate among population between the ages 16 and 19 in the United States with a correlation coefficient (R) of 0.203 and weighted average of 34.8%, a difference of 14.8%.
Serbian vs Immigrants from Pakistan In Labor Force | Age 16-19

In Labor Force | Age 16-19 Correlation Summary

MeasurementSerbianImmigrants from Pakistan
Minimum4.4%2.0%
Maximum100.0%78.6%
Range95.6%76.6%
Mean48.0%36.0%
Median43.6%35.7%
Interquartile 25% (IQ1)37.9%31.8%
Interquartile 75% (IQ3)55.9%38.5%
Interquartile Range (IQR)18.0%6.7%
Standard Deviation (Sample)18.1%11.4%
Standard Deviation (Population)17.8%11.3%

Similar Demographics by In Labor Force | Age 16-19

Demographics Similar to Serbians by In Labor Force | Age 16-19

In terms of in labor force | age 16-19, the demographic groups most similar to Serbians are Iroquois (39.9%, a difference of 0.010%), Immigrants from Middle Africa (39.9%, a difference of 0.040%), Portuguese (40.0%, a difference of 0.17%), Potawatomi (40.0%, a difference of 0.22%), and Hungarian (39.8%, a difference of 0.27%).
DemographicsRating | RankIn Labor Force | Age 16-19
Immigrants | Micronesia
100.0
/100
|
#64
Exceptional
40.2%
Kenyans
100.0
/100
|
#65
Exceptional
40.1%
Immigrants | Nonimmigrants
100.0
/100
|
#66
Exceptional
40.1%
Canadians
100.0
/100
|
#67
Exceptional
40.1%
Italians
99.9
/100
|
#68
Exceptional
40.1%
Potawatomi
99.9
/100
|
#69
Exceptional
40.0%
Portuguese
99.9
/100
|
#70
Exceptional
40.0%
Serbians
99.9
/100
|
#71
Exceptional
39.9%
Iroquois
99.9
/100
|
#72
Exceptional
39.9%
Immigrants | Middle Africa
99.9
/100
|
#73
Exceptional
39.9%
Hungarians
99.9
/100
|
#74
Exceptional
39.8%
French American Indians
99.9
/100
|
#75
Exceptional
39.8%
Malaysians
99.9
/100
|
#76
Exceptional
39.7%
Immigrants | Portugal
99.9
/100
|
#77
Exceptional
39.7%
Austrians
99.8
/100
|
#78
Exceptional
39.5%

Demographics Similar to Immigrants from Pakistan by In Labor Force | Age 16-19

In terms of in labor force | age 16-19, the demographic groups most similar to Immigrants from Pakistan are Immigrants from Western Asia (34.8%, a difference of 0.020%), Immigrants from Chile (34.8%, a difference of 0.030%), Immigrants from Ukraine (34.8%, a difference of 0.10%), Central American (34.8%, a difference of 0.13%), and Laotian (34.9%, a difference of 0.21%).
DemographicsRating | RankIn Labor Force | Age 16-19
Pueblo
2.6
/100
|
#243
Tragic
34.9%
Immigrants | Turkey
2.6
/100
|
#244
Tragic
34.9%
Immigrants | Greece
2.4
/100
|
#245
Tragic
34.9%
Immigrants | Sri Lanka
2.4
/100
|
#246
Tragic
34.9%
Laotians
2.4
/100
|
#247
Tragic
34.9%
Central Americans
2.2
/100
|
#248
Tragic
34.8%
Immigrants | Ukraine
2.2
/100
|
#249
Tragic
34.8%
Immigrants | Pakistan
2.0
/100
|
#250
Tragic
34.8%
Immigrants | Western Asia
2.0
/100
|
#251
Tragic
34.8%
Immigrants | Chile
2.0
/100
|
#252
Tragic
34.8%
Immigrants | Japan
1.5
/100
|
#253
Tragic
34.7%
Bahamians
1.4
/100
|
#254
Tragic
34.6%
Peruvians
1.4
/100
|
#255
Tragic
34.6%
Immigrants | South Central Asia
1.3
/100
|
#256
Tragic
34.6%
Immigrants | Egypt
1.2
/100
|
#257
Tragic
34.6%