Scottish vs Immigrants from North Macedonia In Labor Force | Age 16-19

COMPARE

Scottish
Race
Ancestry
AfghanAfricanAlaska NativeAlaskan AthabascanAlbanianAleutAlsatianAmericanApacheArabArapahoArgentineanArmenianAssyrian/Chaldean/SyriacAustralianAustrianBahamianBangladeshiBarbadianBasqueBelgianBelizeanBermudanBhutaneseBlackfeetBolivianBrazilianBritishBritish West IndianBulgarianBurmeseCajunCambodianCanadianCape VerdeanCarpatho RusynCelticCentral AmericanCentral American IndianCherokeeCheyenneChickasawChileanChineseChippewaChoctawColombianColvilleComancheCosta RicanCreeCreekCroatianCrowCubanCypriotCzechCzechoslovakianDanishDelawareDominicanDutchDutch West IndianEastern EuropeanEcuadorianEgyptianEnglishEstonianEthiopianEuropeanFijianFilipinoFinnishFrenchFrench American IndianFrench CanadianGermanGerman RussianGhanaianGreekGuamanian/ChamorroGuatemalanGuyaneseHaitianHmongHonduranHopiHoumaHungarianIcelanderIndian (Asian)IndonesianInupiatIranianIraqiIrishIroquoisIsraeliItalianJamaicanJapaneseJordanianKenyanKiowaKoreanLaotianLatvianLebaneseLiberianLithuanianLumbeeLuxembourgerMacedonianMalaysianMalteseMarshalleseMenomineeMexicanMexican American IndianMongolianMoroccanNative HawaiianNavajoNepaleseNew ZealanderNicaraguanNigerianNorthern EuropeanNorwegianOkinawanOsageOttawaPaiutePakistaniPalestinianPanamanianParaguayanPennsylvania GermanPeruvianPimaPolishPortuguesePotawatomiPuebloPuerto RicanPuget Sound SalishRomanianRussianSalvadoranSamoanScandinavianScotch-IrishScottishSeminoleSenegaleseSerbianShoshoneSierra LeoneanSiouxSlavicSlovakSloveneSomaliSouth AfricanSouth AmericanSouth American IndianSoviet UnionSpaniardSpanishSpanish AmericanSpanish American IndianSri LankanSubsaharan AfricanSudaneseSwedishSwissSyrianTaiwaneseThaiTlingit-HaidaTohono O'OdhamTonganTrinidadian and TobagonianTsimshianTurkishU.S. Virgin IslanderUgandanUkrainianUruguayanUteVenezuelanVietnameseWelshWest IndianYakamaYaquiYugoslavianYumanYup'ikZimbabwean
Immigration
NonimmigrantsImmigrantsAfghanistanAfricaAlbaniaArgentinaArmeniaAsiaAustraliaAustriaBahamasBangladeshBarbadosBelarusBelgiumBelizeBoliviaBosnia and HerzegovinaBrazilBulgariaBurma/MyanmarCabo VerdeCambodiaCameroonCanadaCaribbeanCentral AmericaChileChinaColombiaCongoCosta RicaCroatiaCubaCzechoslovakiaDenmarkDominicaDominican RepublicEastern AfricaEastern AsiaEastern EuropeEcuadorEgyptEl SalvadorEnglandEritreaEthiopiaEuropeFijiFranceGermanyGhanaGreeceGrenadaGuatemalaGuyanaHaitiHondurasHong KongHungaryIndiaIndonesiaIranIraqIrelandIsraelItalyJamaicaJapanJordanKazakhstanKenyaKoreaKuwaitLaosLatin AmericaLatviaLebanonLiberiaLithuaniaMalaysiaMexicoMicronesiaMiddle AfricaMoldovaMoroccoNepalNetherlandsNicaraguaNigeriaNorth AmericaNorthern AfricaNorthern EuropeNorwayOceaniaPakistanPanamaPeruPhilippinesPolandPortugalRomaniaRussiaSaudi ArabiaScotlandSenegalSerbiaSierra LeoneSingaporeSomaliaSouth AfricaSouth AmericaSouth Central AsiaSouth Eastern AsiaSouthern EuropeSpainSri LankaSt. Vincent and the GrenadinesSudanSwedenSwitzerlandSyriaTaiwanThailandTrinidad and TobagoTurkeyUgandaUkraineUruguayUzbekistanVenezuelaVietnamWest IndiesWestern AfricaWestern AsiaWestern EuropeYemenZaireZimbabweAzores
Immigrants from North Macedonia
Race
Ancestry
AfghanAfricanAlaska NativeAlaskan AthabascanAlbanianAleutAlsatianAmericanApacheArabArapahoArgentineanArmenianAssyrian/Chaldean/SyriacAustralianAustrianBahamianBangladeshiBarbadianBasqueBelgianBelizeanBermudanBhutaneseBlackfeetBolivianBrazilianBritishBritish West IndianBulgarianBurmeseCajunCambodianCanadianCape VerdeanCarpatho RusynCelticCentral AmericanCentral American IndianCherokeeCheyenneChickasawChileanChineseChippewaChoctawColombianColvilleComancheCosta RicanCreeCreekCroatianCrowCubanCypriotCzechCzechoslovakianDanishDelawareDominicanDutchDutch West IndianEastern EuropeanEcuadorianEgyptianEnglishEstonianEthiopianEuropeanFijianFilipinoFinnishFrenchFrench American IndianFrench CanadianGermanGerman RussianGhanaianGreekGuamanian/ChamorroGuatemalanGuyaneseHaitianHmongHonduranHopiHoumaHungarianIcelanderIndian (Asian)IndonesianInupiatIranianIraqiIrishIroquoisIsraeliItalianJamaicanJapaneseJordanianKenyanKiowaKoreanLaotianLatvianLebaneseLiberianLithuanianLumbeeLuxembourgerMacedonianMalaysianMalteseMarshalleseMenomineeMexicanMexican American IndianMongolianMoroccanNative HawaiianNavajoNepaleseNew ZealanderNicaraguanNigerianNorthern EuropeanNorwegianOkinawanOsageOttawaPaiutePakistaniPalestinianPanamanianParaguayanPennsylvania GermanPeruvianPimaPolishPortuguesePotawatomiPuebloPuerto RicanPuget Sound SalishRomanianRussianSalvadoranSamoanScandinavianScotch-IrishSeminoleSenegaleseSerbianShoshoneSierra LeoneanSiouxSlavicSlovakSloveneSomaliSouth AfricanSouth AmericanSouth American IndianSoviet UnionSpaniardSpanishSpanish AmericanSpanish American IndianSri LankanSubsaharan AfricanSudaneseSwedishSwissSyrianTaiwaneseThaiTlingit-HaidaTohono O'OdhamTonganTrinidadian and TobagonianTsimshianTurkishU.S. Virgin IslanderUgandanUkrainianUruguayanUteVenezuelanVietnameseWelshWest IndianYakamaYaquiYugoslavianYumanYup'ikZimbabwean
Immigration
NonimmigrantsImmigrantsAfghanistanAfricaAlbaniaArgentinaArmeniaAsiaAustraliaAustriaBahamasBangladeshBarbadosBelarusBelgiumBelizeBoliviaBosnia and HerzegovinaBrazilBulgariaBurma/MyanmarCabo VerdeCambodiaCameroonCanadaCaribbeanCentral AmericaChileChinaColombiaCongoCosta RicaCroatiaCubaCzechoslovakiaDenmarkDominicaDominican RepublicEastern AfricaEastern AsiaEastern EuropeEcuadorEgyptEl SalvadorEnglandEritreaEthiopiaEuropeFijiFranceGermanyGhanaGreeceGrenadaGuatemalaGuyanaHaitiHondurasHong KongHungaryIndiaIndonesiaIranIraqIrelandIsraelItalyJamaicaJapanJordanKazakhstanKenyaKoreaKuwaitLaosLatin AmericaLatviaLebanonLiberiaLithuaniaMalaysiaMexicoMicronesiaMiddle AfricaMoldovaMoroccoNepalNetherlandsNicaraguaNigeriaNorth AmericaNorth MacedoniaNorthern AfricaNorthern EuropeNorwayOceaniaPakistanPanamaPeruPhilippinesPolandPortugalRomaniaRussiaSaudi ArabiaScotlandSenegalSerbiaSierra LeoneSingaporeSomaliaSouth AfricaSouth AmericaSouth Central AsiaSouth Eastern AsiaSouthern EuropeSpainSri LankaSt. Vincent and the GrenadinesSudanSwedenSwitzerlandSyriaTaiwanThailandTrinidad and TobagoTurkeyUgandaUkraineUruguayUzbekistanVenezuelaVietnamWest IndiesWestern AfricaWestern AsiaWestern EuropeYemenZaireZimbabweAzores
In Labor Force | Age 16-19
Income
Poverty
Unemployment
Labor Participation
Family Structure
Vehicle Availability
Education Level
Disability

In Labor Force | Age 16-19 Comparison

Scottish

Immigrants from North Macedonia

Exceptional
Exceptional
42.0%
IN LABOR FORCE | AGE 16-19
100.0/ 100
METRIC RATING
30th/ 347
METRIC RANK
38.9%
IN LABOR FORCE | AGE 16-19
99.3/ 100
METRIC RATING
99th/ 347
METRIC RANK

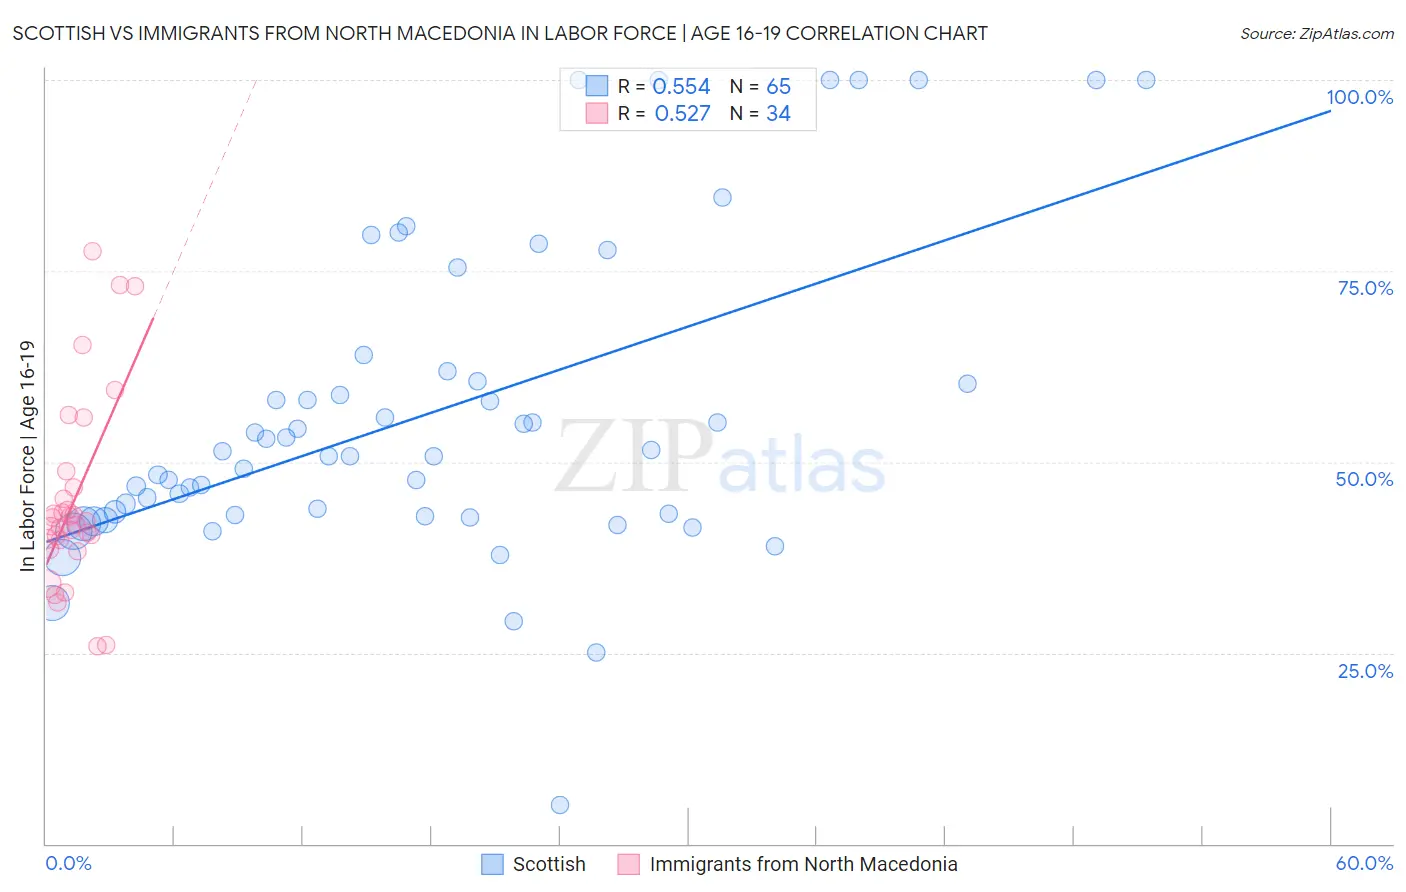
Scottish vs Immigrants from North Macedonia In Labor Force | Age 16-19 Correlation Chart

The statistical analysis conducted on geographies consisting of 562,983,292 people shows a substantial positive correlation between the proportion of Scottish and labor force participation rate among population between the ages 16 and 19 in the United States with a correlation coefficient (R) of 0.554 and weighted average of 42.0%. Similarly, the statistical analysis conducted on geographies consisting of 74,262,337 people shows a substantial positive correlation between the proportion of Immigrants from North Macedonia and labor force participation rate among population between the ages 16 and 19 in the United States with a correlation coefficient (R) of 0.527 and weighted average of 38.9%, a difference of 8.1%.
Scottish vs Immigrants from North Macedonia In Labor Force | Age 16-19

In Labor Force | Age 16-19 Correlation Summary

MeasurementScottishImmigrants from North Macedonia
Minimum5.0%25.9%
Maximum100.0%77.6%
Range95.0%51.7%
Mean56.2%45.0%
Median50.8%42.0%
Interquartile 25% (IQ1)42.9%39.8%
Interquartile 75% (IQ3)61.2%46.7%
Interquartile Range (IQR)18.3%7.0%
Standard Deviation (Sample)20.5%12.5%
Standard Deviation (Population)20.4%12.3%

Similar Demographics by In Labor Force | Age 16-19

Demographics Similar to Scottish by In Labor Force | Age 16-19

In terms of in labor force | age 16-19, the demographic groups most similar to Scottish are Irish (42.0%, a difference of 0.070%), Czechoslovakian (41.9%, a difference of 0.27%), French (42.1%, a difference of 0.28%), Polish (42.1%, a difference of 0.33%), and Liberian (41.8%, a difference of 0.41%).
DemographicsRating | RankIn Labor Force | Age 16-19
Slovaks
100.0
/100
|
#23
Exceptional
42.6%
Bangladeshis
100.0
/100
|
#24
Exceptional
42.5%
German Russians
100.0
/100
|
#25
Exceptional
42.4%
English
100.0
/100
|
#26
Exceptional
42.4%
Welsh
100.0
/100
|
#27
Exceptional
42.3%
Poles
100.0
/100
|
#28
Exceptional
42.1%
French
100.0
/100
|
#29
Exceptional
42.1%
Scottish
100.0
/100
|
#30
Exceptional
42.0%
Irish
100.0
/100
|
#31
Exceptional
42.0%
Czechoslovakians
100.0
/100
|
#32
Exceptional
41.9%
Liberians
100.0
/100
|
#33
Exceptional
41.8%
Immigrants | Bosnia and Herzegovina
100.0
/100
|
#34
Exceptional
41.8%
Yugoslavians
100.0
/100
|
#35
Exceptional
41.8%
Immigrants | Azores
100.0
/100
|
#36
Exceptional
41.7%
Immigrants | Congo
100.0
/100
|
#37
Exceptional
41.7%

Demographics Similar to Immigrants from North Macedonia by In Labor Force | Age 16-19

In terms of in labor force | age 16-19, the demographic groups most similar to Immigrants from North Macedonia are Ugandan (38.9%, a difference of 0.020%), Greek (38.9%, a difference of 0.030%), Latvian (38.9%, a difference of 0.070%), Immigrants from North America (38.9%, a difference of 0.10%), and Blackfeet (38.9%, a difference of 0.19%).
DemographicsRating | RankIn Labor Force | Age 16-19
Osage
99.4
/100
|
#92
Exceptional
39.0%
Blackfeet
99.4
/100
|
#93
Exceptional
38.9%
Immigrants | Canada
99.4
/100
|
#94
Exceptional
38.9%
Immigrants | North America
99.4
/100
|
#95
Exceptional
38.9%
Latvians
99.4
/100
|
#96
Exceptional
38.9%
Greeks
99.3
/100
|
#97
Exceptional
38.9%
Ugandans
99.3
/100
|
#98
Exceptional
38.9%
Immigrants | North Macedonia
99.3
/100
|
#99
Exceptional
38.9%
Immigrants | Thailand
99.1
/100
|
#100
Exceptional
38.7%
Hmong
99.1
/100
|
#101
Exceptional
38.7%
Zimbabweans
99.1
/100
|
#102
Exceptional
38.7%
Immigrants | Cameroon
99.0
/100
|
#103
Exceptional
38.7%
Immigrants | Eritrea
99.0
/100
|
#104
Exceptional
38.7%
Iraqis
98.9
/100
|
#105
Exceptional
38.6%
Delaware
98.8
/100
|
#106
Exceptional
38.6%