Puget Sound Salish vs Salvadoran In Labor Force | Age 25-29
COMPARE
Puget Sound Salish
Salvadoran
In Labor Force | Age 25-29
In Labor Force | Age 25-29 Comparison
Puget Sound Salish
Salvadorans
83.5%
IN LABOR FORCE | AGE 25-29
0.1/ 100
METRIC RATING
264th/ 347
METRIC RANK
83.8%
IN LABOR FORCE | AGE 25-29
0.5/ 100
METRIC RATING
243rd/ 347
METRIC RANK
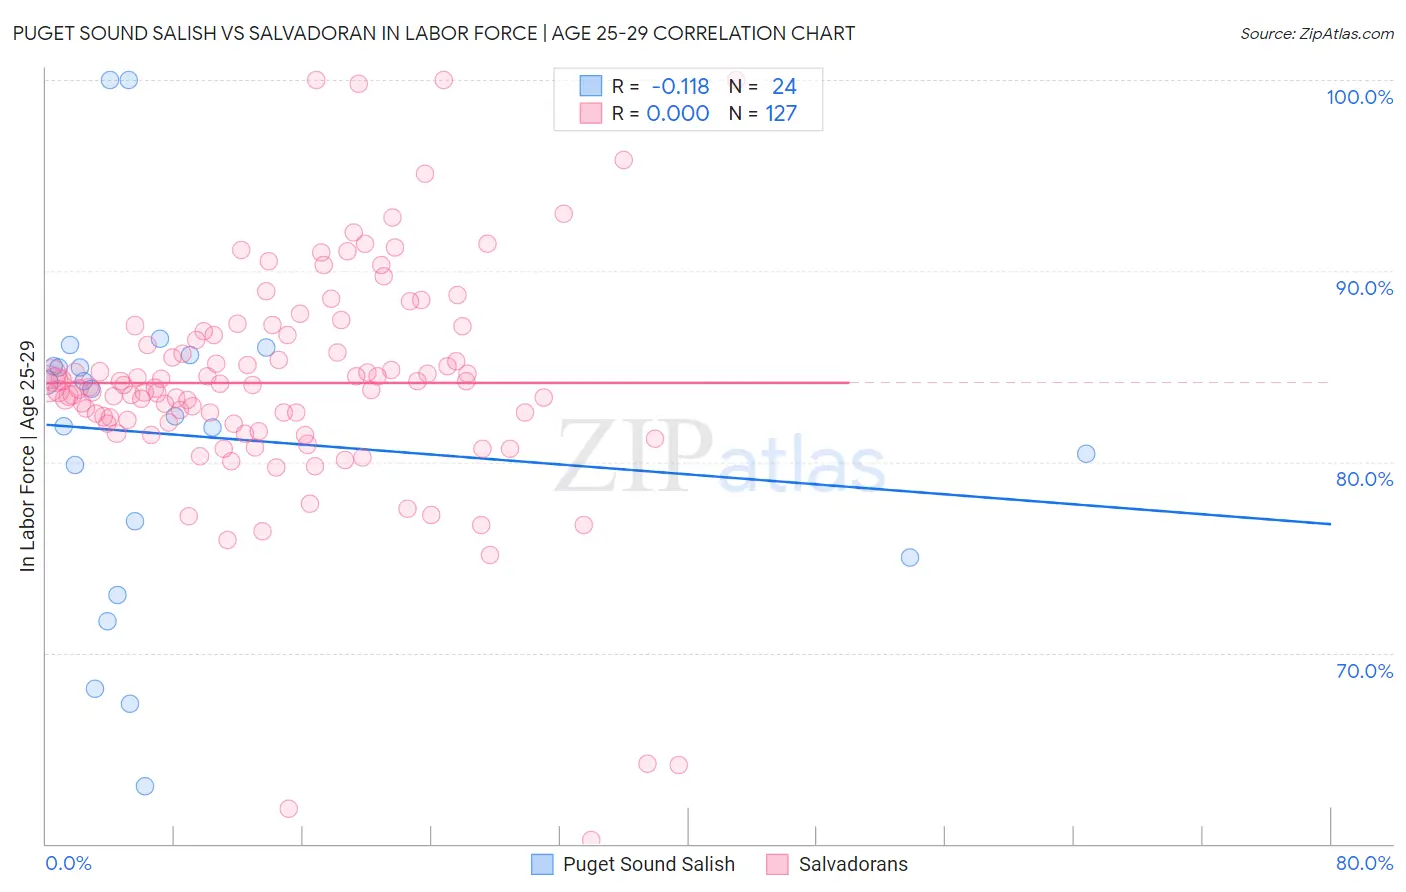
Puget Sound Salish vs Salvadoran In Labor Force | Age 25-29 Correlation Chart
The statistical analysis conducted on geographies consisting of 46,150,488 people shows a poor negative correlation between the proportion of Puget Sound Salish and labor force participation rate among population between the ages 25 and 29 in the United States with a correlation coefficient (R) of -0.118 and weighted average of 83.5%. Similarly, the statistical analysis conducted on geographies consisting of 398,899,857 people shows no correlation between the proportion of Salvadorans and labor force participation rate among population between the ages 25 and 29 in the United States with a correlation coefficient (R) of 0.000 and weighted average of 83.8%, a difference of 0.43%.
In Labor Force | Age 25-29 Correlation Summary
| Measurement | Puget Sound Salish | Salvadoran |
| Minimum | 63.0% | 60.2% |
| Maximum | 100.0% | 100.0% |
| Range | 37.0% | 39.8% |
| Mean | 81.4% | 84.1% |
| Median | 83.1% | 84.0% |
| Interquartile 25% (IQ1) | 76.0% | 82.0% |
| Interquartile 75% (IQ3) | 85.3% | 86.7% |
| Interquartile Range (IQR) | 9.4% | 4.6% |
| Standard Deviation (Sample) | 8.8% | 6.1% |
| Standard Deviation (Population) | 8.6% | 6.1% |
Similar Demographics by In Labor Force | Age 25-29
Demographics Similar to Puget Sound Salish by In Labor Force | Age 25-29
In terms of in labor force | age 25-29, the demographic groups most similar to Puget Sound Salish are Cuban (83.5%, a difference of 0.0%), Aleut (83.4%, a difference of 0.040%), Spanish American (83.4%, a difference of 0.050%), West Indian (83.5%, a difference of 0.060%), and Immigrants from Lebanon (83.4%, a difference of 0.060%).
| Demographics | Rating | Rank | In Labor Force | Age 25-29 |
| Delaware | 0.2 /100 | #257 | Tragic 83.7% |
| Immigrants | Guatemala | 0.1 /100 | #258 | Tragic 83.6% |
| Spanish | 0.1 /100 | #259 | Tragic 83.6% |
| Immigrants | Bahamas | 0.1 /100 | #260 | Tragic 83.6% |
| Pennsylvania Germans | 0.1 /100 | #261 | Tragic 83.6% |
| Immigrants | Fiji | 0.1 /100 | #262 | Tragic 83.6% |
| West Indians | 0.1 /100 | #263 | Tragic 83.5% |
| Puget Sound Salish | 0.1 /100 | #264 | Tragic 83.5% |
| Cubans | 0.1 /100 | #265 | Tragic 83.5% |
| Aleuts | 0.0 /100 | #266 | Tragic 83.4% |
| Spanish Americans | 0.0 /100 | #267 | Tragic 83.4% |
| Immigrants | Lebanon | 0.0 /100 | #268 | Tragic 83.4% |
| Immigrants | Barbados | 0.0 /100 | #269 | Tragic 83.4% |
| Basques | 0.0 /100 | #270 | Tragic 83.4% |
| Hondurans | 0.0 /100 | #271 | Tragic 83.4% |
Demographics Similar to Salvadorans by In Labor Force | Age 25-29
In terms of in labor force | age 25-29, the demographic groups most similar to Salvadorans are U.S. Virgin Islander (83.8%, a difference of 0.010%), Alsatian (83.9%, a difference of 0.040%), Immigrants from Jamaica (83.8%, a difference of 0.040%), Iroquois (83.8%, a difference of 0.040%), and Jamaican (83.9%, a difference of 0.070%).
| Demographics | Rating | Rank | In Labor Force | Age 25-29 |
| Guamanians/Chamorros | 0.9 /100 | #236 | Tragic 83.9% |
| Immigrants | Immigrants | 0.9 /100 | #237 | Tragic 83.9% |
| Immigrants | Uzbekistan | 0.8 /100 | #238 | Tragic 83.9% |
| Jamaicans | 0.8 /100 | #239 | Tragic 83.9% |
| Trinidadians and Tobagonians | 0.7 /100 | #240 | Tragic 83.9% |
| Alsatians | 0.7 /100 | #241 | Tragic 83.9% |
| U.S. Virgin Islanders | 0.6 /100 | #242 | Tragic 83.8% |
| Salvadorans | 0.5 /100 | #243 | Tragic 83.8% |
| Immigrants | Jamaica | 0.4 /100 | #244 | Tragic 83.8% |
| Iroquois | 0.4 /100 | #245 | Tragic 83.8% |
| Cree | 0.3 /100 | #246 | Tragic 83.8% |
| Immigrants | El Salvador | 0.3 /100 | #247 | Tragic 83.7% |
| Immigrants | Nonimmigrants | 0.3 /100 | #248 | Tragic 83.7% |
| Hmong | 0.3 /100 | #249 | Tragic 83.7% |
| Central Americans | 0.2 /100 | #250 | Tragic 83.7% |