Puerto Rican vs Immigrants from Nicaragua In Labor Force | Age 30-34
COMPARE
Puerto Rican
Immigrants from Nicaragua
In Labor Force | Age 30-34
In Labor Force | Age 30-34 Comparison
Puerto Ricans
Immigrants from Nicaragua
81.2%
IN LABOR FORCE | AGE 30-34
0.0/ 100
METRIC RATING
322nd/ 347
METRIC RANK
83.9%
IN LABOR FORCE | AGE 30-34
0.6/ 100
METRIC RATING
253rd/ 347
METRIC RANK
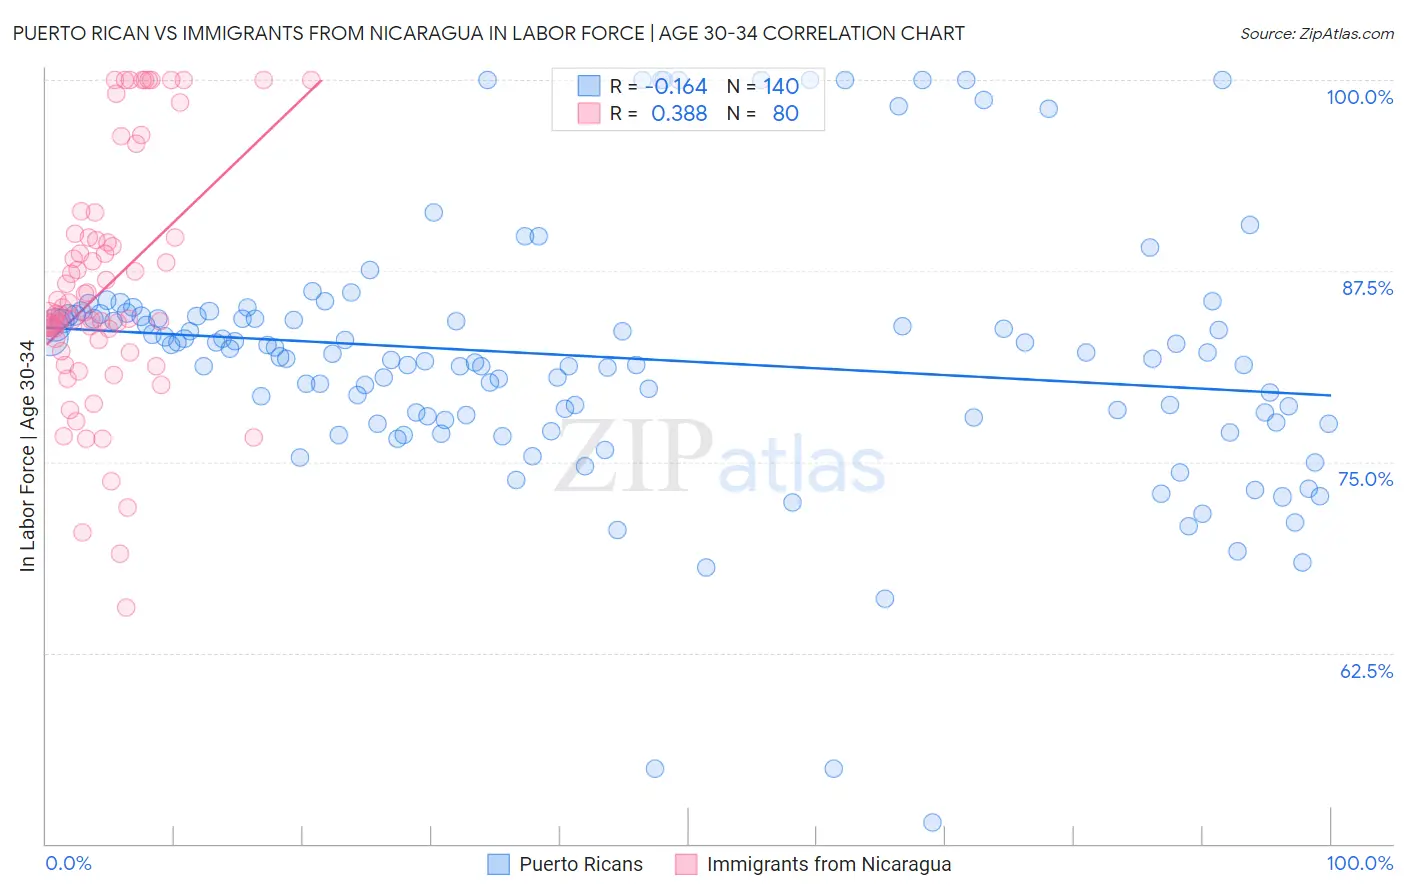
Puerto Rican vs Immigrants from Nicaragua In Labor Force | Age 30-34 Correlation Chart
The statistical analysis conducted on geographies consisting of 527,590,157 people shows a poor negative correlation between the proportion of Puerto Ricans and labor force participation rate among population between the ages 30 and 34 in the United States with a correlation coefficient (R) of -0.164 and weighted average of 81.2%. Similarly, the statistical analysis conducted on geographies consisting of 236,321,659 people shows a mild positive correlation between the proportion of Immigrants from Nicaragua and labor force participation rate among population between the ages 30 and 34 in the United States with a correlation coefficient (R) of 0.388 and weighted average of 83.9%, a difference of 3.3%.
In Labor Force | Age 30-34 Correlation Summary
| Measurement | Puerto Rican | Immigrants from Nicaragua |
| Minimum | 51.4% | 65.5% |
| Maximum | 100.0% | 100.0% |
| Range | 48.6% | 34.5% |
| Mean | 81.9% | 86.5% |
| Median | 82.0% | 84.7% |
| Interquartile 25% (IQ1) | 77.8% | 82.6% |
| Interquartile 75% (IQ3) | 84.6% | 89.7% |
| Interquartile Range (IQR) | 6.8% | 7.1% |
| Standard Deviation (Sample) | 8.5% | 8.0% |
| Standard Deviation (Population) | 8.4% | 7.9% |
Similar Demographics by In Labor Force | Age 30-34
Demographics Similar to Puerto Ricans by In Labor Force | Age 30-34
In terms of in labor force | age 30-34, the demographic groups most similar to Puerto Ricans are Paiute (81.2%, a difference of 0.050%), Cheyenne (81.1%, a difference of 0.080%), Alaska Native (81.3%, a difference of 0.16%), Dutch West Indian (81.0%, a difference of 0.23%), and Yaqui (81.4%, a difference of 0.24%).
| Demographics | Rating | Rank | In Labor Force | Age 30-34 |
| Cherokee | 0.0 /100 | #315 | Tragic 81.6% |
| Immigrants | Azores | 0.0 /100 | #316 | Tragic 81.5% |
| Arapaho | 0.0 /100 | #317 | Tragic 81.5% |
| Choctaw | 0.0 /100 | #318 | Tragic 81.4% |
| Shoshone | 0.0 /100 | #319 | Tragic 81.4% |
| Yaqui | 0.0 /100 | #320 | Tragic 81.4% |
| Alaska Natives | 0.0 /100 | #321 | Tragic 81.3% |
| Puerto Ricans | 0.0 /100 | #322 | Tragic 81.2% |
| Paiute | 0.0 /100 | #323 | Tragic 81.2% |
| Cheyenne | 0.0 /100 | #324 | Tragic 81.1% |
| Dutch West Indians | 0.0 /100 | #325 | Tragic 81.0% |
| Seminole | 0.0 /100 | #326 | Tragic 80.8% |
| Colville | 0.0 /100 | #327 | Tragic 80.7% |
| Sioux | 0.0 /100 | #328 | Tragic 80.4% |
| Creek | 0.0 /100 | #329 | Tragic 80.4% |
Demographics Similar to Immigrants from Nicaragua by In Labor Force | Age 30-34
In terms of in labor force | age 30-34, the demographic groups most similar to Immigrants from Nicaragua are Bahamian (83.9%, a difference of 0.0%), Nicaraguan (83.9%, a difference of 0.010%), Immigrants from Iraq (83.9%, a difference of 0.020%), Immigrants from St. Vincent and the Grenadines (83.9%, a difference of 0.020%), and Immigrants from Dominica (84.0%, a difference of 0.040%).
| Demographics | Rating | Rank | In Labor Force | Age 30-34 |
| Central Americans | 0.9 /100 | #246 | Tragic 84.0% |
| British West Indians | 0.8 /100 | #247 | Tragic 84.0% |
| Portuguese | 0.8 /100 | #248 | Tragic 84.0% |
| Immigrants | Dominica | 0.7 /100 | #249 | Tragic 84.0% |
| Immigrants | Iraq | 0.7 /100 | #250 | Tragic 83.9% |
| Nicaraguans | 0.6 /100 | #251 | Tragic 83.9% |
| Bahamians | 0.6 /100 | #252 | Tragic 83.9% |
| Immigrants | Nicaragua | 0.6 /100 | #253 | Tragic 83.9% |
| Immigrants | St. Vincent and the Grenadines | 0.5 /100 | #254 | Tragic 83.9% |
| Whites/Caucasians | 0.5 /100 | #255 | Tragic 83.9% |
| Immigrants | Lebanon | 0.4 /100 | #256 | Tragic 83.9% |
| Iraqis | 0.3 /100 | #257 | Tragic 83.8% |
| Hondurans | 0.3 /100 | #258 | Tragic 83.8% |
| Scotch-Irish | 0.3 /100 | #259 | Tragic 83.8% |
| Immigrants | Dominican Republic | 0.3 /100 | #260 | Tragic 83.8% |