Potawatomi vs Cheyenne In Labor Force | Age 35-44
COMPARE
Potawatomi
Cheyenne
In Labor Force | Age 35-44
In Labor Force | Age 35-44 Comparison
Potawatomi
Cheyenne
82.7%
IN LABOR FORCE | AGE 35-44
0.0/ 100
METRIC RATING
294th/ 347
METRIC RANK
79.5%
IN LABOR FORCE | AGE 35-44
0.0/ 100
METRIC RATING
330th/ 347
METRIC RANK
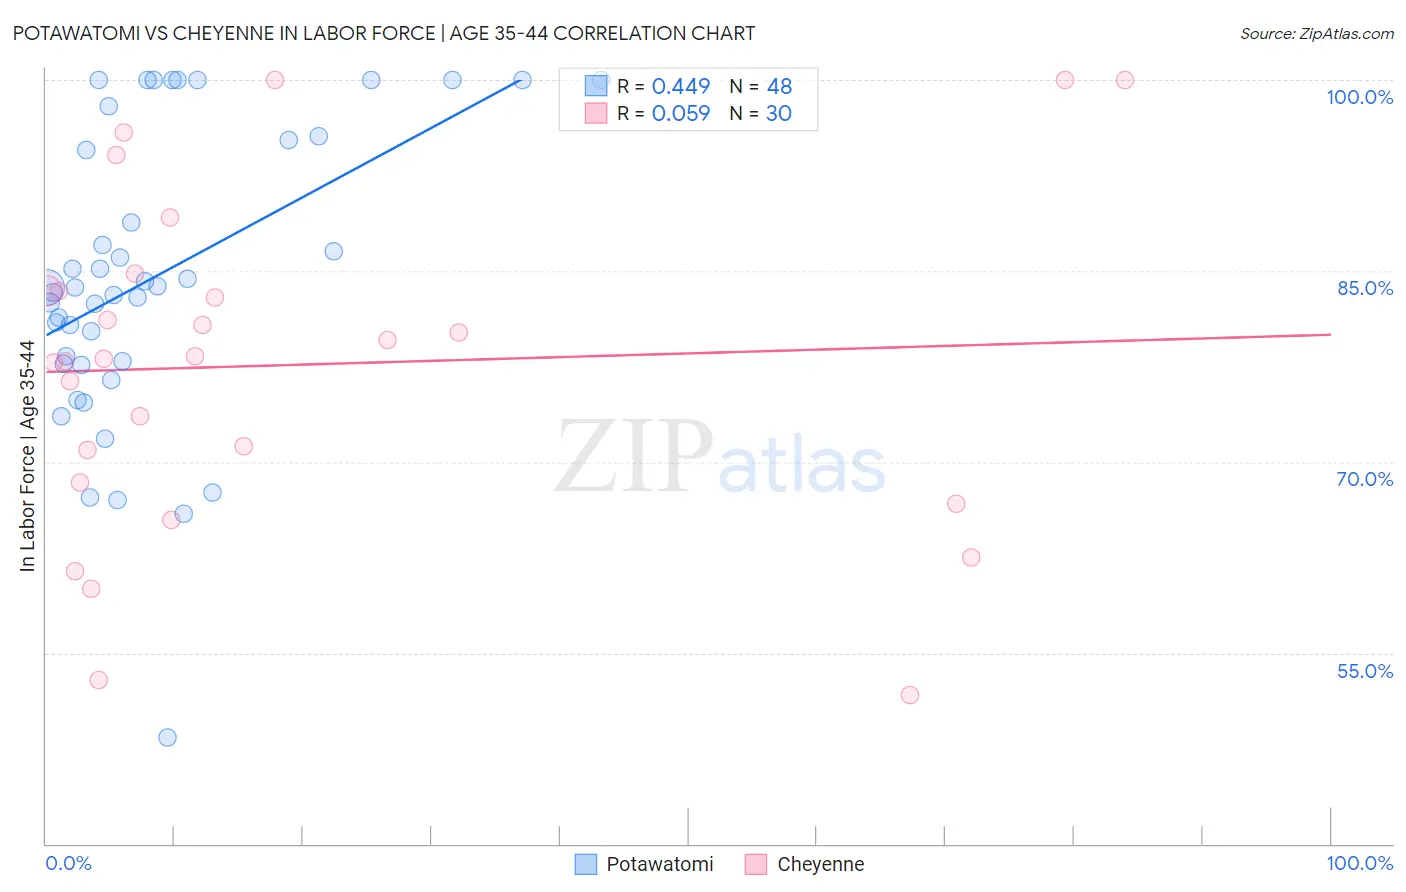
Potawatomi vs Cheyenne In Labor Force | Age 35-44 Correlation Chart
The statistical analysis conducted on geographies consisting of 117,764,721 people shows a moderate positive correlation between the proportion of Potawatomi and labor force participation rate among population between the ages 35 and 44 in the United States with a correlation coefficient (R) of 0.449 and weighted average of 82.7%. Similarly, the statistical analysis conducted on geographies consisting of 80,703,463 people shows a slight positive correlation between the proportion of Cheyenne and labor force participation rate among population between the ages 35 and 44 in the United States with a correlation coefficient (R) of 0.059 and weighted average of 79.5%, a difference of 4.0%.
In Labor Force | Age 35-44 Correlation Summary
| Measurement | Potawatomi | Cheyenne |
| Minimum | 48.3% | 51.7% |
| Maximum | 100.0% | 100.0% |
| Range | 51.7% | 48.3% |
| Mean | 84.5% | 77.6% |
| Median | 83.7% | 78.2% |
| Interquartile 25% (IQ1) | 77.8% | 68.3% |
| Interquartile 75% (IQ3) | 95.5% | 83.4% |
| Interquartile Range (IQR) | 17.6% | 15.1% |
| Standard Deviation (Sample) | 11.6% | 13.1% |
| Standard Deviation (Population) | 11.4% | 12.9% |
Similar Demographics by In Labor Force | Age 35-44
Demographics Similar to Potawatomi by In Labor Force | Age 35-44
In terms of in labor force | age 35-44, the demographic groups most similar to Potawatomi are Immigrants from Lebanon (82.7%, a difference of 0.050%), Spanish American (82.8%, a difference of 0.080%), Mexican American Indian (82.6%, a difference of 0.15%), Hmong (82.6%, a difference of 0.16%), and Immigrants from Latin America (82.8%, a difference of 0.17%).
| Demographics | Rating | Rank | In Labor Force | Age 35-44 |
| Immigrants | Belize | 0.0 /100 | #287 | Tragic 82.9% |
| Puget Sound Salish | 0.0 /100 | #288 | Tragic 82.9% |
| Chippewa | 0.0 /100 | #289 | Tragic 82.9% |
| Africans | 0.0 /100 | #290 | Tragic 82.9% |
| Pennsylvania Germans | 0.0 /100 | #291 | Tragic 82.9% |
| Immigrants | Latin America | 0.0 /100 | #292 | Tragic 82.8% |
| Spanish Americans | 0.0 /100 | #293 | Tragic 82.8% |
| Potawatomi | 0.0 /100 | #294 | Tragic 82.7% |
| Immigrants | Lebanon | 0.0 /100 | #295 | Tragic 82.7% |
| Mexican American Indians | 0.0 /100 | #296 | Tragic 82.6% |
| Hmong | 0.0 /100 | #297 | Tragic 82.6% |
| Ottawa | 0.0 /100 | #298 | Tragic 82.6% |
| Tlingit-Haida | 0.0 /100 | #299 | Tragic 82.5% |
| Central American Indians | 0.0 /100 | #300 | Tragic 82.5% |
| Spanish American Indians | 0.0 /100 | #301 | Tragic 82.5% |
Demographics Similar to Cheyenne by In Labor Force | Age 35-44
In terms of in labor force | age 35-44, the demographic groups most similar to Cheyenne are Houma (79.5%, a difference of 0.020%), Ute (79.4%, a difference of 0.080%), Menominee (79.7%, a difference of 0.20%), Kiowa (79.2%, a difference of 0.41%), and Creek (80.0%, a difference of 0.64%).
| Demographics | Rating | Rank | In Labor Force | Age 35-44 |
| Yaqui | 0.0 /100 | #323 | Tragic 80.5% |
| Choctaw | 0.0 /100 | #324 | Tragic 80.5% |
| Dutch West Indians | 0.0 /100 | #325 | Tragic 80.4% |
| Seminole | 0.0 /100 | #326 | Tragic 80.4% |
| Sioux | 0.0 /100 | #327 | Tragic 80.2% |
| Creek | 0.0 /100 | #328 | Tragic 80.0% |
| Menominee | 0.0 /100 | #329 | Tragic 79.7% |
| Cheyenne | 0.0 /100 | #330 | Tragic 79.5% |
| Houma | 0.0 /100 | #331 | Tragic 79.5% |
| Ute | 0.0 /100 | #332 | Tragic 79.4% |
| Kiowa | 0.0 /100 | #333 | Tragic 79.2% |
| Yakama | 0.0 /100 | #334 | Tragic 79.0% |
| Natives/Alaskans | 0.0 /100 | #335 | Tragic 78.9% |
| Arapaho | 0.0 /100 | #336 | Tragic 78.1% |
| Apache | 0.0 /100 | #337 | Tragic 77.9% |