Portuguese vs Immigrants from Zimbabwe In Labor Force | Age 16-19

COMPARE

Portuguese
Race
Ancestry
AfghanAfricanAlaska NativeAlaskan AthabascanAlbanianAleutAlsatianAmericanApacheArabArapahoArgentineanArmenianAssyrian/Chaldean/SyriacAustralianAustrianBahamianBangladeshiBarbadianBasqueBelgianBelizeanBermudanBhutaneseBlackfeetBolivianBrazilianBritishBritish West IndianBulgarianBurmeseCajunCambodianCanadianCape VerdeanCarpatho RusynCelticCentral AmericanCentral American IndianCherokeeCheyenneChickasawChileanChineseChippewaChoctawColombianColvilleComancheCosta RicanCreeCreekCroatianCrowCubanCypriotCzechCzechoslovakianDanishDelawareDominicanDutchDutch West IndianEastern EuropeanEcuadorianEgyptianEnglishEstonianEthiopianEuropeanFijianFilipinoFinnishFrenchFrench American IndianFrench CanadianGermanGerman RussianGhanaianGreekGuamanian/ChamorroGuatemalanGuyaneseHaitianHmongHonduranHopiHoumaHungarianIcelanderIndian (Asian)IndonesianInupiatIranianIraqiIrishIroquoisIsraeliItalianJamaicanJapaneseJordanianKenyanKiowaKoreanLaotianLatvianLebaneseLiberianLithuanianLumbeeLuxembourgerMacedonianMalaysianMalteseMarshalleseMenomineeMexicanMexican American IndianMongolianMoroccanNative HawaiianNavajoNepaleseNew ZealanderNicaraguanNigerianNorthern EuropeanNorwegianOkinawanOsageOttawaPaiutePakistaniPalestinianPanamanianParaguayanPennsylvania GermanPeruvianPimaPolishPortuguesePotawatomiPuebloPuerto RicanPuget Sound SalishRomanianRussianSalvadoranSamoanScandinavianScotch-IrishScottishSeminoleSenegaleseSerbianShoshoneSierra LeoneanSiouxSlavicSlovakSloveneSomaliSouth AfricanSouth AmericanSouth American IndianSoviet UnionSpaniardSpanishSpanish AmericanSpanish American IndianSri LankanSubsaharan AfricanSudaneseSwedishSwissSyrianTaiwaneseThaiTlingit-HaidaTohono O'OdhamTonganTrinidadian and TobagonianTsimshianTurkishU.S. Virgin IslanderUgandanUkrainianUruguayanUteVenezuelanVietnameseWelshWest IndianYakamaYaquiYugoslavianYumanYup'ikZimbabwean
Immigration
NonimmigrantsImmigrantsAfghanistanAfricaAlbaniaArgentinaArmeniaAsiaAustraliaAustriaBahamasBangladeshBarbadosBelarusBelgiumBelizeBoliviaBosnia and HerzegovinaBrazilBulgariaBurma/MyanmarCabo VerdeCambodiaCameroonCanadaCaribbeanCentral AmericaChileChinaColombiaCongoCosta RicaCroatiaCubaCzechoslovakiaDenmarkDominicaDominican RepublicEastern AfricaEastern AsiaEastern EuropeEcuadorEgyptEl SalvadorEnglandEritreaEthiopiaEuropeFijiFranceGermanyGhanaGreeceGrenadaGuatemalaGuyanaHaitiHondurasHong KongHungaryIndiaIndonesiaIranIraqIrelandIsraelItalyJamaicaJapanJordanKazakhstanKenyaKoreaKuwaitLaosLatin AmericaLatviaLebanonLiberiaLithuaniaMalaysiaMexicoMicronesiaMiddle AfricaMoldovaMoroccoNepalNetherlandsNicaraguaNigeriaNorth AmericaNorth MacedoniaNorthern AfricaNorthern EuropeNorwayOceaniaPakistanPanamaPeruPhilippinesPolandPortugalRomaniaRussiaSaudi ArabiaScotlandSenegalSerbiaSierra LeoneSingaporeSomaliaSouth AfricaSouth AmericaSouth Central AsiaSouth Eastern AsiaSouthern EuropeSpainSri LankaSt. Vincent and the GrenadinesSudanSwedenSwitzerlandSyriaTaiwanThailandTrinidad and TobagoTurkeyUgandaUkraineUruguayUzbekistanVenezuelaVietnamWest IndiesWestern AfricaWestern AsiaWestern EuropeYemenZaireAzores
Immigrants from Zimbabwe
Race
Ancestry
AfghanAfricanAlaska NativeAlaskan AthabascanAlbanianAleutAlsatianAmericanApacheArabArapahoArgentineanArmenianAssyrian/Chaldean/SyriacAustralianAustrianBahamianBangladeshiBarbadianBasqueBelgianBelizeanBermudanBhutaneseBlackfeetBolivianBrazilianBritishBritish West IndianBulgarianBurmeseCajunCambodianCanadianCape VerdeanCarpatho RusynCelticCentral AmericanCentral American IndianCherokeeCheyenneChickasawChileanChineseChippewaChoctawColombianColvilleComancheCosta RicanCreeCreekCroatianCrowCubanCypriotCzechCzechoslovakianDanishDelawareDominicanDutchDutch West IndianEastern EuropeanEcuadorianEgyptianEnglishEstonianEthiopianEuropeanFijianFilipinoFinnishFrenchFrench American IndianFrench CanadianGermanGerman RussianGhanaianGreekGuamanian/ChamorroGuatemalanGuyaneseHaitianHmongHonduranHopiHoumaHungarianIcelanderIndian (Asian)IndonesianInupiatIranianIraqiIrishIroquoisIsraeliItalianJamaicanJapaneseJordanianKenyanKiowaKoreanLaotianLatvianLebaneseLiberianLithuanianLumbeeLuxembourgerMacedonianMalaysianMalteseMarshalleseMenomineeMexicanMexican American IndianMongolianMoroccanNative HawaiianNavajoNepaleseNew ZealanderNicaraguanNigerianNorthern EuropeanNorwegianOkinawanOsageOttawaPaiutePakistaniPalestinianPanamanianParaguayanPennsylvania GermanPeruvianPimaPolishPotawatomiPuebloPuerto RicanPuget Sound SalishRomanianRussianSalvadoranSamoanScandinavianScotch-IrishScottishSeminoleSenegaleseSerbianShoshoneSierra LeoneanSiouxSlavicSlovakSloveneSomaliSouth AfricanSouth AmericanSouth American IndianSoviet UnionSpaniardSpanishSpanish AmericanSpanish American IndianSri LankanSubsaharan AfricanSudaneseSwedishSwissSyrianTaiwaneseThaiTlingit-HaidaTohono O'OdhamTonganTrinidadian and TobagonianTsimshianTurkishU.S. Virgin IslanderUgandanUkrainianUruguayanUteVenezuelanVietnameseWelshWest IndianYakamaYaquiYugoslavianYumanYup'ikZimbabwean
Immigration
NonimmigrantsImmigrantsAfghanistanAfricaAlbaniaArgentinaArmeniaAsiaAustraliaAustriaBahamasBangladeshBarbadosBelarusBelgiumBelizeBoliviaBosnia and HerzegovinaBrazilBulgariaBurma/MyanmarCabo VerdeCambodiaCameroonCanadaCaribbeanCentral AmericaChileChinaColombiaCongoCosta RicaCroatiaCubaCzechoslovakiaDenmarkDominicaDominican RepublicEastern AfricaEastern AsiaEastern EuropeEcuadorEgyptEl SalvadorEnglandEritreaEthiopiaEuropeFijiFranceGermanyGhanaGreeceGrenadaGuatemalaGuyanaHaitiHondurasHong KongHungaryIndiaIndonesiaIranIraqIrelandIsraelItalyJamaicaJapanJordanKazakhstanKenyaKoreaKuwaitLaosLatin AmericaLatviaLebanonLiberiaLithuaniaMalaysiaMexicoMicronesiaMiddle AfricaMoldovaMoroccoNepalNetherlandsNicaraguaNigeriaNorth AmericaNorth MacedoniaNorthern AfricaNorthern EuropeNorwayOceaniaPakistanPanamaPeruPhilippinesPolandPortugalRomaniaRussiaSaudi ArabiaScotlandSenegalSerbiaSierra LeoneSingaporeSomaliaSouth AfricaSouth AmericaSouth Central AsiaSouth Eastern AsiaSouthern EuropeSpainSri LankaSt. Vincent and the GrenadinesSudanSwedenSwitzerlandSyriaTaiwanThailandTrinidad and TobagoTurkeyUgandaUkraineUruguayUzbekistanVenezuelaVietnamWest IndiesWestern AfricaWestern AsiaWestern EuropeYemenZaireZimbabweAzores
In Labor Force | Age 16-19
Income
Poverty
Unemployment
Labor Participation
Family Structure
Vehicle Availability
Education Level
Disability

In Labor Force | Age 16-19 Comparison

Portuguese

Immigrants from Zimbabwe

Exceptional
Exceptional
40.0%
IN LABOR FORCE | AGE 16-19
99.9/ 100
METRIC RATING
70th/ 347
METRIC RANK
38.0%
IN LABOR FORCE | AGE 16-19
95.4/ 100
METRIC RATING
130th/ 347
METRIC RANK

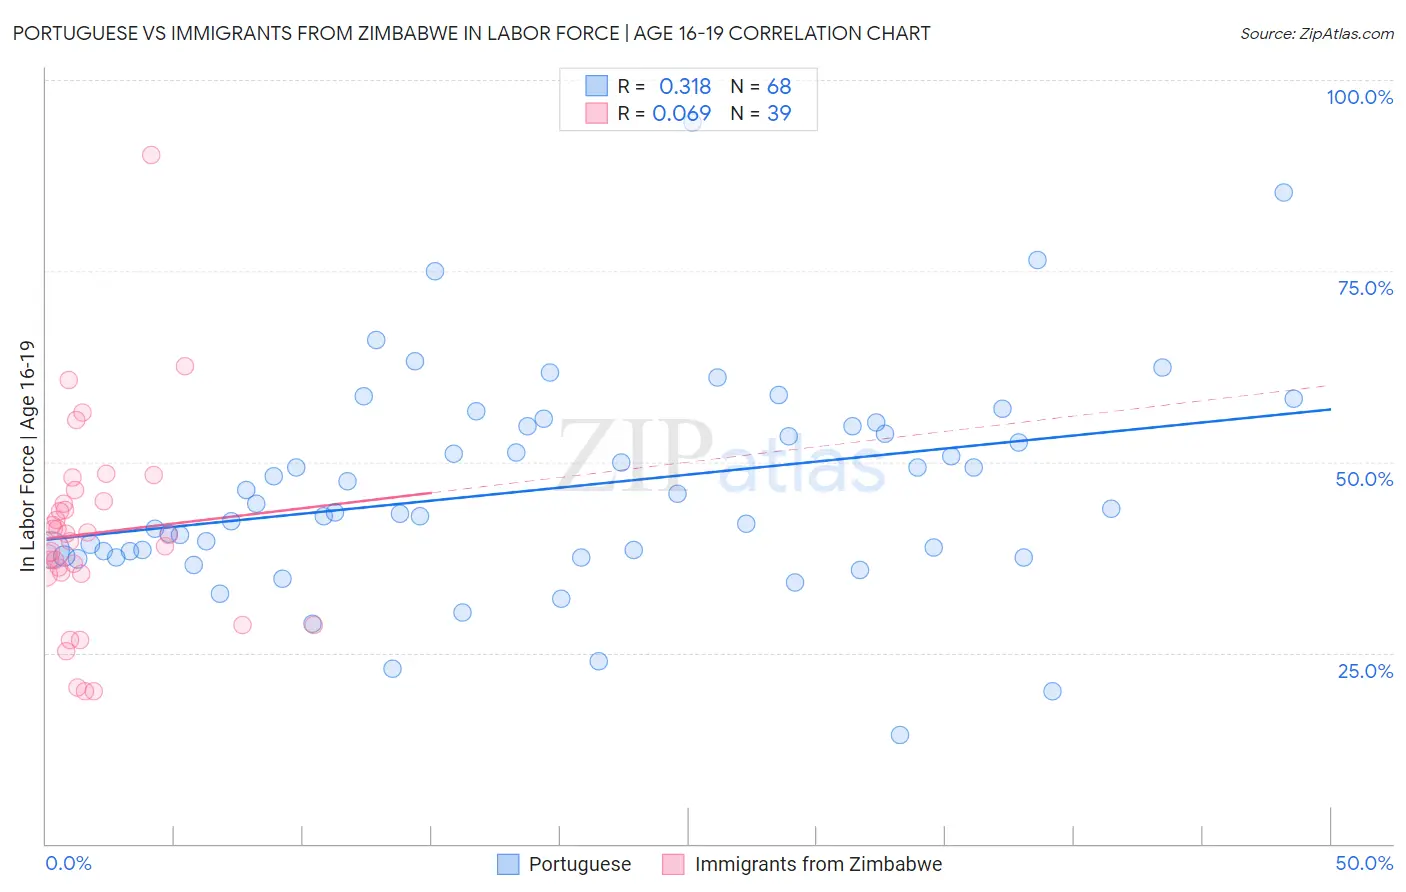
Portuguese vs Immigrants from Zimbabwe In Labor Force | Age 16-19 Correlation Chart

The statistical analysis conducted on geographies consisting of 449,088,849 people shows a mild positive correlation between the proportion of Portuguese and labor force participation rate among population between the ages 16 and 19 in the United States with a correlation coefficient (R) of 0.318 and weighted average of 40.0%. Similarly, the statistical analysis conducted on geographies consisting of 117,770,176 people shows a slight positive correlation between the proportion of Immigrants from Zimbabwe and labor force participation rate among population between the ages 16 and 19 in the United States with a correlation coefficient (R) of 0.069 and weighted average of 38.0%, a difference of 5.4%.
Portuguese vs Immigrants from Zimbabwe In Labor Force | Age 16-19

In Labor Force | Age 16-19 Correlation Summary

MeasurementPortugueseImmigrants from Zimbabwe
Minimum14.2%20.0%
Maximum94.4%90.2%
Range80.2%70.2%
Mean46.5%40.6%
Median43.6%40.4%
Interquartile 25% (IQ1)38.0%35.3%
Interquartile 75% (IQ3)54.6%44.9%
Interquartile Range (IQR)16.7%9.6%
Standard Deviation (Sample)14.1%13.0%
Standard Deviation (Population)14.0%12.8%

Similar Demographics by In Labor Force | Age 16-19

Demographics Similar to Portuguese by In Labor Force | Age 16-19

In terms of in labor force | age 16-19, the demographic groups most similar to Portuguese are Potawatomi (40.0%, a difference of 0.050%), Italian (40.1%, a difference of 0.12%), Serbian (39.9%, a difference of 0.17%), Iroquois (39.9%, a difference of 0.17%), and Canadian (40.1%, a difference of 0.18%).
DemographicsRating | RankIn Labor Force | Age 16-19
Northern Europeans
100.0
/100
|
#63
Exceptional
40.2%
Immigrants | Micronesia
100.0
/100
|
#64
Exceptional
40.2%
Kenyans
100.0
/100
|
#65
Exceptional
40.1%
Immigrants | Nonimmigrants
100.0
/100
|
#66
Exceptional
40.1%
Canadians
100.0
/100
|
#67
Exceptional
40.1%
Italians
99.9
/100
|
#68
Exceptional
40.1%
Potawatomi
99.9
/100
|
#69
Exceptional
40.0%
Portuguese
99.9
/100
|
#70
Exceptional
40.0%
Serbians
99.9
/100
|
#71
Exceptional
39.9%
Iroquois
99.9
/100
|
#72
Exceptional
39.9%
Immigrants | Middle Africa
99.9
/100
|
#73
Exceptional
39.9%
Hungarians
99.9
/100
|
#74
Exceptional
39.8%
French American Indians
99.9
/100
|
#75
Exceptional
39.8%
Malaysians
99.9
/100
|
#76
Exceptional
39.7%
Immigrants | Portugal
99.9
/100
|
#77
Exceptional
39.7%

Demographics Similar to Immigrants from Zimbabwe by In Labor Force | Age 16-19

In terms of in labor force | age 16-19, the demographic groups most similar to Immigrants from Zimbabwe are Spaniard (38.0%, a difference of 0.030%), New Zealander (38.0%, a difference of 0.050%), African (38.0%, a difference of 0.060%), Choctaw (38.0%, a difference of 0.060%), and Immigrants from Austria (37.9%, a difference of 0.090%).
DemographicsRating | RankIn Labor Force | Age 16-19
Seminole
96.7
/100
|
#123
Exceptional
38.1%
Immigrants | England
96.4
/100
|
#124
Exceptional
38.1%
Immigrants | Africa
96.1
/100
|
#125
Exceptional
38.0%
Africans
95.6
/100
|
#126
Exceptional
38.0%
Choctaw
95.6
/100
|
#127
Exceptional
38.0%
New Zealanders
95.6
/100
|
#128
Exceptional
38.0%
Spaniards
95.5
/100
|
#129
Exceptional
38.0%
Immigrants | Zimbabwe
95.4
/100
|
#130
Exceptional
38.0%
Immigrants | Austria
95.0
/100
|
#131
Exceptional
37.9%
Immigrants | Oceania
94.7
/100
|
#132
Exceptional
37.9%
Cheyenne
94.6
/100
|
#133
Exceptional
37.9%
Immigrants | Netherlands
93.7
/100
|
#134
Exceptional
37.8%
Macedonians
93.4
/100
|
#135
Exceptional
37.8%
Australians
93.2
/100
|
#136
Exceptional
37.8%
Cajuns
93.2
/100
|
#137
Exceptional
37.8%