Pakistani vs New Zealander In Labor Force | Age 16-19
COMPARE
Pakistani
New Zealander
In Labor Force | Age 16-19
In Labor Force | Age 16-19 Comparison
Pakistanis
New Zealanders
37.6%
IN LABOR FORCE | AGE 16-19
89.5/ 100
METRIC RATING
143rd/ 347
METRIC RANK
38.0%
IN LABOR FORCE | AGE 16-19
95.6/ 100
METRIC RATING
128th/ 347
METRIC RANK
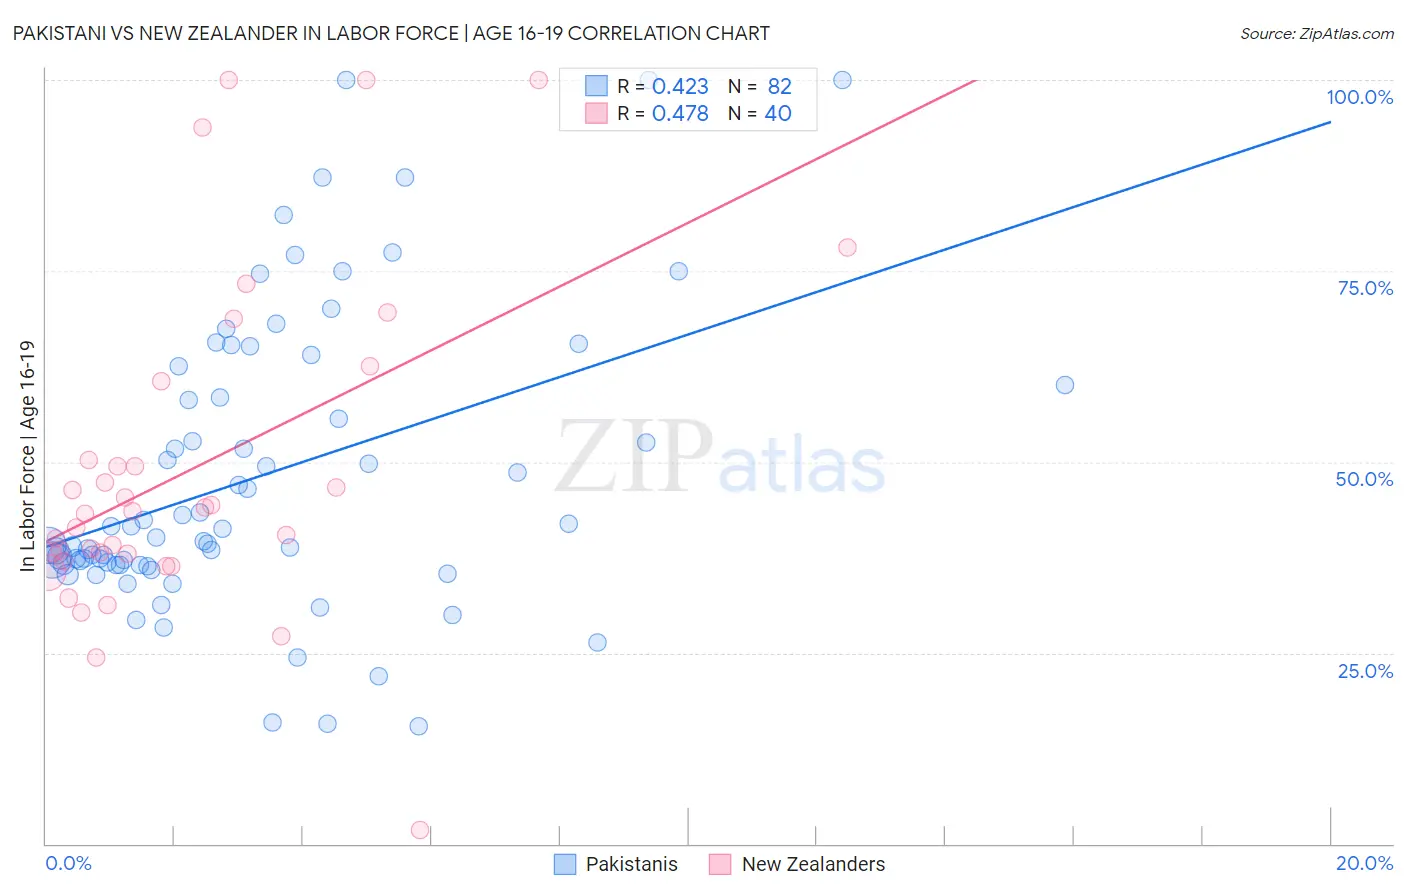
Pakistani vs New Zealander In Labor Force | Age 16-19 Correlation Chart
The statistical analysis conducted on geographies consisting of 335,000,628 people shows a moderate positive correlation between the proportion of Pakistanis and labor force participation rate among population between the ages 16 and 19 in the United States with a correlation coefficient (R) of 0.423 and weighted average of 37.6%. Similarly, the statistical analysis conducted on geographies consisting of 106,856,856 people shows a moderate positive correlation between the proportion of New Zealanders and labor force participation rate among population between the ages 16 and 19 in the United States with a correlation coefficient (R) of 0.478 and weighted average of 38.0%, a difference of 1.1%.
In Labor Force | Age 16-19 Correlation Summary
| Measurement | Pakistani | New Zealander |
| Minimum | 15.4% | 1.8% |
| Maximum | 100.0% | 100.0% |
| Range | 84.6% | 98.2% |
| Mean | 48.1% | 49.0% |
| Median | 40.7% | 43.4% |
| Interquartile 25% (IQ1) | 36.5% | 37.5% |
| Interquartile 75% (IQ3) | 60.0% | 55.4% |
| Interquartile Range (IQR) | 23.5% | 17.8% |
| Standard Deviation (Sample) | 19.2% | 21.7% |
| Standard Deviation (Population) | 19.1% | 21.4% |
Demographics Similar to Pakistanis and New Zealanders by In Labor Force | Age 16-19
In terms of in labor force | age 16-19, the demographic groups most similar to Pakistanis are Japanese (37.5%, a difference of 0.020%), Paiute (37.5%, a difference of 0.020%), Sierra Leonean (37.6%, a difference of 0.030%), Syrian (37.6%, a difference of 0.18%), and Estonian (37.7%, a difference of 0.32%). Similarly, the demographic groups most similar to New Zealanders are Choctaw (38.0%, a difference of 0.0%), African (38.0%, a difference of 0.010%), Spaniard (38.0%, a difference of 0.020%), Immigrants from Zimbabwe (38.0%, a difference of 0.050%), and Immigrants from Austria (37.9%, a difference of 0.15%).
| Demographics | Rating | Rank | In Labor Force | Age 16-19 |
| Immigrants | Africa | 96.1 /100 | #125 | Exceptional 38.0% |
| Africans | 95.6 /100 | #126 | Exceptional 38.0% |
| Choctaw | 95.6 /100 | #127 | Exceptional 38.0% |
| New Zealanders | 95.6 /100 | #128 | Exceptional 38.0% |
| Spaniards | 95.5 /100 | #129 | Exceptional 38.0% |
| Immigrants | Zimbabwe | 95.4 /100 | #130 | Exceptional 38.0% |
| Immigrants | Austria | 95.0 /100 | #131 | Exceptional 37.9% |
| Immigrants | Oceania | 94.7 /100 | #132 | Exceptional 37.9% |
| Cheyenne | 94.6 /100 | #133 | Exceptional 37.9% |
| Immigrants | Netherlands | 93.7 /100 | #134 | Exceptional 37.8% |
| Macedonians | 93.4 /100 | #135 | Exceptional 37.8% |
| Australians | 93.2 /100 | #136 | Exceptional 37.8% |
| Cajuns | 93.2 /100 | #137 | Exceptional 37.8% |
| Comanche | 91.9 /100 | #138 | Exceptional 37.7% |
| Immigrants | Moldova | 91.9 /100 | #139 | Exceptional 37.7% |
| Estonians | 91.7 /100 | #140 | Exceptional 37.7% |
| Syrians | 90.7 /100 | #141 | Exceptional 37.6% |
| Sierra Leoneans | 89.7 /100 | #142 | Excellent 37.6% |
| Pakistanis | 89.5 /100 | #143 | Excellent 37.6% |
| Japanese | 89.3 /100 | #144 | Excellent 37.5% |
| Paiute | 89.3 /100 | #145 | Excellent 37.5% |