Pakistani vs French American Indian In Labor Force | Age > 16
COMPARE
Pakistani
French American Indian
In Labor Force | Age > 16
In Labor Force | Age > 16 Comparison
Pakistanis
French American Indians
65.8%
IN LABOR FORCE | AGE > 16
97.1/ 100
METRIC RATING
113th/ 347
METRIC RANK
64.1%
IN LABOR FORCE | AGE > 16
0.3/ 100
METRIC RATING
276th/ 347
METRIC RANK
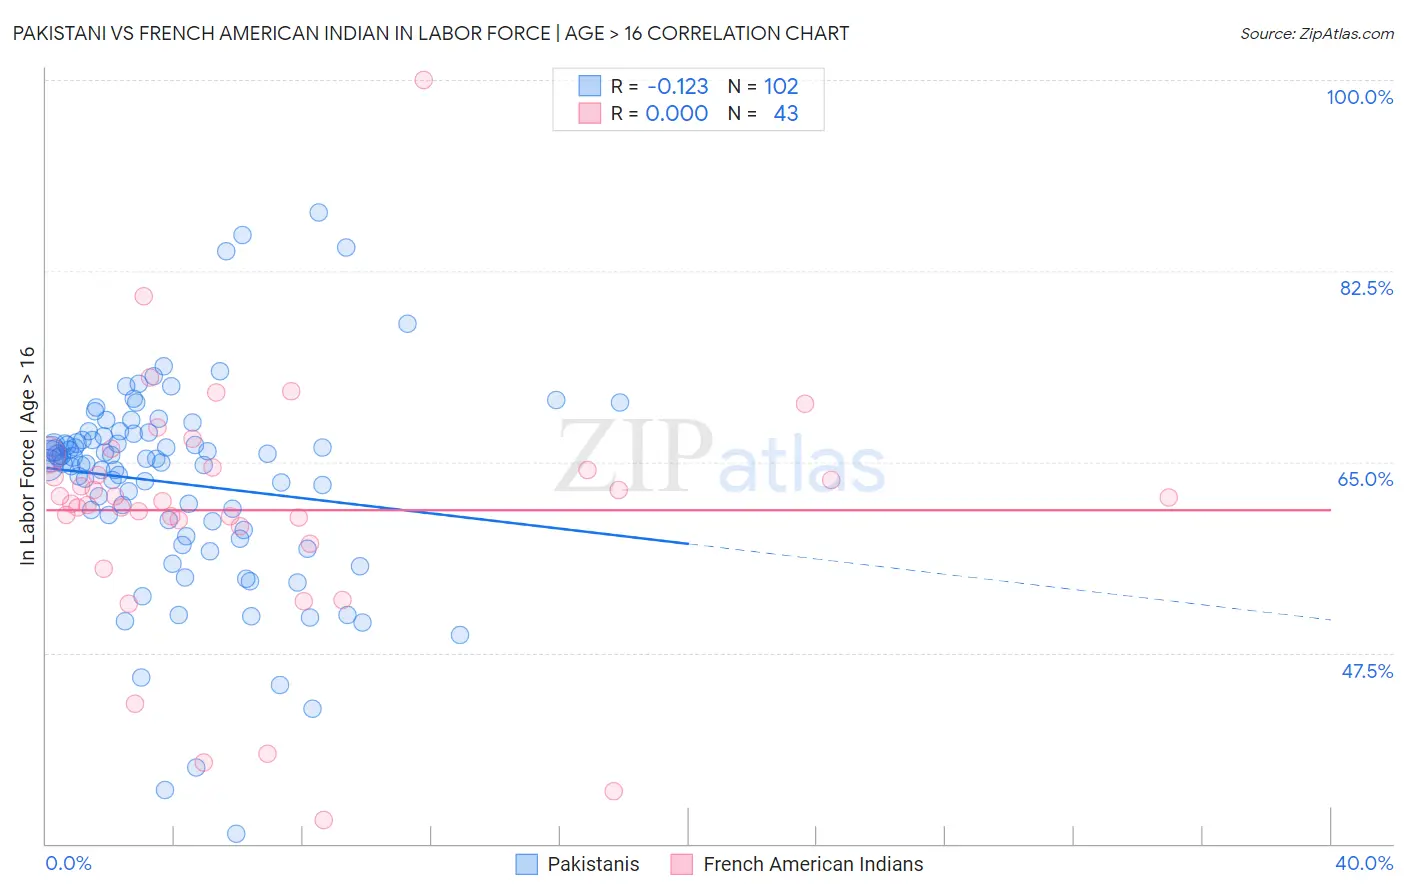
Pakistani vs French American Indian In Labor Force | Age > 16 Correlation Chart
The statistical analysis conducted on geographies consisting of 335,364,967 people shows a poor negative correlation between the proportion of Pakistanis and labor force participation rate among population ages 16 and over in the United States with a correlation coefficient (R) of -0.123 and weighted average of 65.8%. Similarly, the statistical analysis conducted on geographies consisting of 131,976,269 people shows no correlation between the proportion of French American Indians and labor force participation rate among population ages 16 and over in the United States with a correlation coefficient (R) of 0.000 and weighted average of 64.1%, a difference of 2.6%.
In Labor Force | Age > 16 Correlation Summary
| Measurement | Pakistani | French American Indian |
| Minimum | 30.9% | 32.2% |
| Maximum | 87.8% | 100.0% |
| Range | 56.9% | 67.8% |
| Mean | 63.1% | 60.6% |
| Median | 65.1% | 61.4% |
| Interquartile 25% (IQ1) | 58.8% | 59.1% |
| Interquartile 75% (IQ3) | 67.3% | 64.5% |
| Interquartile Range (IQR) | 8.5% | 5.3% |
| Standard Deviation (Sample) | 9.5% | 11.7% |
| Standard Deviation (Population) | 9.5% | 11.5% |
Similar Demographics by In Labor Force | Age > 16
Demographics Similar to Pakistanis by In Labor Force | Age > 16
In terms of in labor force | age > 16, the demographic groups most similar to Pakistanis are Honduran (65.8%, a difference of 0.010%), Laotian (65.8%, a difference of 0.030%), Immigrants from Indonesia (65.7%, a difference of 0.030%), Immigrants from Honduras (65.8%, a difference of 0.040%), and Argentinean (65.7%, a difference of 0.040%).
| Demographics | Rating | Rank | In Labor Force | Age > 16 |
| Immigrants | Serbia | 98.1 /100 | #106 | Exceptional 65.8% |
| Immigrants | Poland | 98.1 /100 | #107 | Exceptional 65.8% |
| Immigrants | Spain | 98.0 /100 | #108 | Exceptional 65.8% |
| Immigrants | Japan | 98.0 /100 | #109 | Exceptional 65.8% |
| Japanese | 97.7 /100 | #110 | Exceptional 65.8% |
| Immigrants | Honduras | 97.5 /100 | #111 | Exceptional 65.8% |
| Laotians | 97.4 /100 | #112 | Exceptional 65.8% |
| Pakistanis | 97.1 /100 | #113 | Exceptional 65.8% |
| Hondurans | 97.1 /100 | #114 | Exceptional 65.8% |
| Immigrants | Indonesia | 96.8 /100 | #115 | Exceptional 65.7% |
| Argentineans | 96.7 /100 | #116 | Exceptional 65.7% |
| Immigrants | Iran | 96.6 /100 | #117 | Exceptional 65.7% |
| Immigrants | Thailand | 96.6 /100 | #118 | Exceptional 65.7% |
| Immigrants | France | 96.4 /100 | #119 | Exceptional 65.7% |
| Immigrants | Hong Kong | 96.2 /100 | #120 | Exceptional 65.7% |
Demographics Similar to French American Indians by In Labor Force | Age > 16
In terms of in labor force | age > 16, the demographic groups most similar to French American Indians are Immigrants from Cuba (64.1%, a difference of 0.0%), Mexican (64.1%, a difference of 0.0%), Native Hawaiian (64.1%, a difference of 0.020%), Hmong (64.1%, a difference of 0.020%), and Immigrants from Bahamas (64.0%, a difference of 0.030%).
| Demographics | Rating | Rank | In Labor Force | Age > 16 |
| Irish | 0.4 /100 | #269 | Tragic 64.1% |
| Guyanese | 0.4 /100 | #270 | Tragic 64.1% |
| Dominicans | 0.4 /100 | #271 | Tragic 64.1% |
| Native Hawaiians | 0.3 /100 | #272 | Tragic 64.1% |
| Hmong | 0.3 /100 | #273 | Tragic 64.1% |
| Immigrants | Cuba | 0.3 /100 | #274 | Tragic 64.1% |
| Mexicans | 0.3 /100 | #275 | Tragic 64.1% |
| French American Indians | 0.3 /100 | #276 | Tragic 64.1% |
| Immigrants | Bahamas | 0.3 /100 | #277 | Tragic 64.0% |
| Assyrians/Chaldeans/Syriacs | 0.3 /100 | #278 | Tragic 64.0% |
| Welsh | 0.2 /100 | #279 | Tragic 64.0% |
| Immigrants | St. Vincent and the Grenadines | 0.2 /100 | #280 | Tragic 64.0% |
| French Canadians | 0.2 /100 | #281 | Tragic 64.0% |
| Immigrants | Guyana | 0.2 /100 | #282 | Tragic 64.0% |
| Immigrants | Germany | 0.1 /100 | #283 | Tragic 63.9% |