Osage vs Immigrants from Nigeria In Labor Force | Age 30-34
COMPARE
Osage
Immigrants from Nigeria
In Labor Force | Age 30-34
In Labor Force | Age 30-34 Comparison
Osage
Immigrants from Nigeria
82.3%
IN LABOR FORCE | AGE 30-34
0.0/ 100
METRIC RATING
305th/ 347
METRIC RANK
84.6%
IN LABOR FORCE | AGE 30-34
42.5/ 100
METRIC RATING
179th/ 347
METRIC RANK
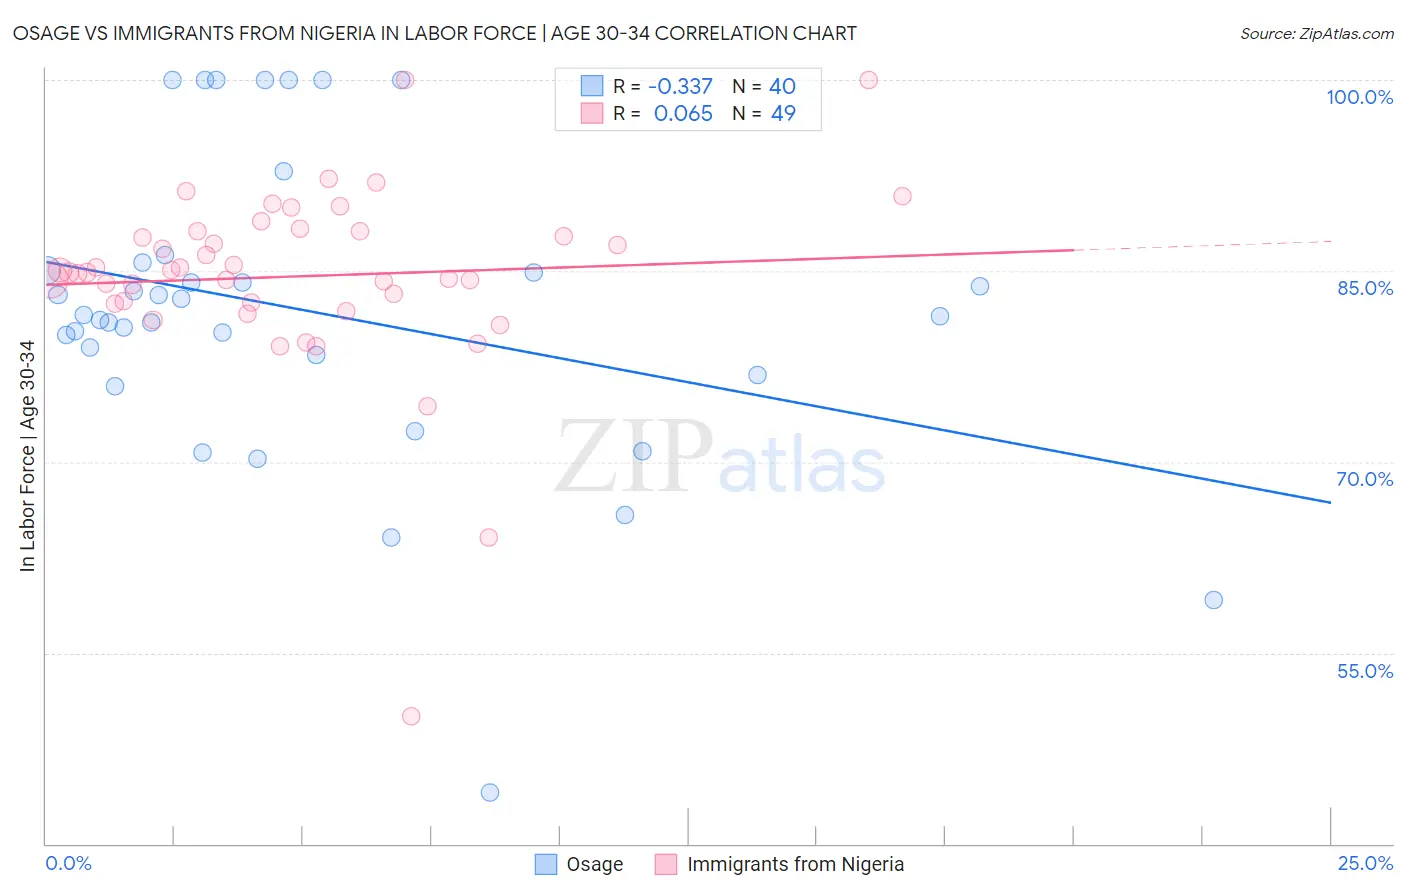
Osage vs Immigrants from Nigeria In Labor Force | Age 30-34 Correlation Chart
The statistical analysis conducted on geographies consisting of 91,795,365 people shows a mild negative correlation between the proportion of Osage and labor force participation rate among population between the ages 30 and 34 in the United States with a correlation coefficient (R) of -0.337 and weighted average of 82.3%. Similarly, the statistical analysis conducted on geographies consisting of 283,347,406 people shows a slight positive correlation between the proportion of Immigrants from Nigeria and labor force participation rate among population between the ages 30 and 34 in the United States with a correlation coefficient (R) of 0.065 and weighted average of 84.6%, a difference of 2.9%.
In Labor Force | Age 30-34 Correlation Summary
| Measurement | Osage | Immigrants from Nigeria |
| Minimum | 44.0% | 50.0% |
| Maximum | 100.0% | 100.0% |
| Range | 56.0% | 50.0% |
| Mean | 81.8% | 84.6% |
| Median | 81.5% | 84.9% |
| Interquartile 25% (IQ1) | 77.6% | 82.5% |
| Interquartile 75% (IQ3) | 85.4% | 88.1% |
| Interquartile Range (IQR) | 7.8% | 5.6% |
| Standard Deviation (Sample) | 12.0% | 7.6% |
| Standard Deviation (Population) | 11.8% | 7.5% |
Similar Demographics by In Labor Force | Age 30-34
Demographics Similar to Osage by In Labor Force | Age 30-34
In terms of in labor force | age 30-34, the demographic groups most similar to Osage are Spanish American Indian (82.2%, a difference of 0.020%), Menominee (82.2%, a difference of 0.070%), Tlingit-Haida (82.3%, a difference of 0.080%), Immigrants from Micronesia (82.4%, a difference of 0.16%), and Ottawa (82.4%, a difference of 0.17%).
| Demographics | Rating | Rank | In Labor Force | Age 30-34 |
| Aleuts | 0.0 /100 | #298 | Tragic 82.6% |
| Immigrants | Central America | 0.0 /100 | #299 | Tragic 82.5% |
| Hmong | 0.0 /100 | #300 | Tragic 82.4% |
| Hispanics or Latinos | 0.0 /100 | #301 | Tragic 82.4% |
| Ottawa | 0.0 /100 | #302 | Tragic 82.4% |
| Immigrants | Micronesia | 0.0 /100 | #303 | Tragic 82.4% |
| Tlingit-Haida | 0.0 /100 | #304 | Tragic 82.3% |
| Osage | 0.0 /100 | #305 | Tragic 82.3% |
| Spanish American Indians | 0.0 /100 | #306 | Tragic 82.2% |
| Menominee | 0.0 /100 | #307 | Tragic 82.2% |
| Puget Sound Salish | 0.0 /100 | #308 | Tragic 82.1% |
| Immigrants | Mexico | 0.0 /100 | #309 | Tragic 82.0% |
| Cajuns | 0.0 /100 | #310 | Tragic 82.0% |
| Chickasaw | 0.0 /100 | #311 | Tragic 81.9% |
| Mexicans | 0.0 /100 | #312 | Tragic 81.9% |
Demographics Similar to Immigrants from Nigeria by In Labor Force | Age 30-34
In terms of in labor force | age 30-34, the demographic groups most similar to Immigrants from Nigeria are Immigrants from Netherlands (84.6%, a difference of 0.0%), Okinawan (84.6%, a difference of 0.010%), Moroccan (84.6%, a difference of 0.020%), Laotian (84.7%, a difference of 0.030%), and Barbadian (84.6%, a difference of 0.040%).
| Demographics | Rating | Rank | In Labor Force | Age 30-34 |
| Immigrants | England | 51.7 /100 | #172 | Average 84.7% |
| Israelis | 51.1 /100 | #173 | Average 84.7% |
| Finns | 50.0 /100 | #174 | Average 84.7% |
| Immigrants | South America | 50.0 /100 | #175 | Average 84.7% |
| Immigrants | Uzbekistan | 49.1 /100 | #176 | Average 84.7% |
| Laotians | 46.9 /100 | #177 | Average 84.7% |
| Okinawans | 44.1 /100 | #178 | Average 84.6% |
| Immigrants | Nigeria | 42.5 /100 | #179 | Average 84.6% |
| Immigrants | Netherlands | 42.1 /100 | #180 | Average 84.6% |
| Moroccans | 40.3 /100 | #181 | Average 84.6% |
| Barbadians | 36.7 /100 | #182 | Fair 84.6% |
| Immigrants | Canada | 35.0 /100 | #183 | Fair 84.6% |
| Immigrants | North America | 33.3 /100 | #184 | Fair 84.6% |
| Immigrants | Philippines | 31.5 /100 | #185 | Fair 84.6% |
| Immigrants | Congo | 29.7 /100 | #186 | Fair 84.6% |