Okinawan vs Immigrants from Ecuador In Labor Force | Age > 16

COMPARE

Okinawan
Race
Ancestry
AfghanAfricanAlaska NativeAlaskan AthabascanAlbanianAleutAlsatianAmericanApacheArabArapahoArgentineanArmenianAssyrian/Chaldean/SyriacAustralianAustrianBahamianBangladeshiBarbadianBasqueBelgianBelizeanBermudanBhutaneseBlackfeetBolivianBrazilianBritishBritish West IndianBulgarianBurmeseCajunCambodianCanadianCape VerdeanCarpatho RusynCelticCentral AmericanCentral American IndianCherokeeCheyenneChickasawChileanChineseChippewaChoctawColombianColvilleComancheCosta RicanCreeCreekCroatianCrowCubanCypriotCzechCzechoslovakianDanishDelawareDominicanDutchDutch West IndianEastern EuropeanEcuadorianEgyptianEnglishEstonianEthiopianEuropeanFijianFilipinoFinnishFrenchFrench American IndianFrench CanadianGermanGerman RussianGhanaianGreekGuamanian/ChamorroGuatemalanGuyaneseHaitianHmongHonduranHopiHoumaHungarianIcelanderIndian (Asian)IndonesianInupiatIranianIraqiIrishIroquoisIsraeliItalianJamaicanJapaneseJordanianKenyanKiowaKoreanLaotianLatvianLebaneseLiberianLithuanianLumbeeLuxembourgerMacedonianMalaysianMalteseMarshalleseMenomineeMexicanMexican American IndianMongolianMoroccanNative HawaiianNavajoNepaleseNew ZealanderNicaraguanNigerianNorthern EuropeanNorwegianOkinawanOsageOttawaPaiutePakistaniPalestinianPanamanianParaguayanPennsylvania GermanPeruvianPimaPolishPortuguesePotawatomiPuebloPuerto RicanPuget Sound SalishRomanianRussianSalvadoranSamoanScandinavianScotch-IrishScottishSeminoleSenegaleseSerbianShoshoneSierra LeoneanSiouxSlavicSlovakSloveneSomaliSouth AfricanSouth AmericanSouth American IndianSoviet UnionSpaniardSpanishSpanish AmericanSpanish American IndianSri LankanSubsaharan AfricanSudaneseSwedishSwissSyrianTaiwaneseThaiTlingit-HaidaTohono O'OdhamTonganTrinidadian and TobagonianTsimshianTurkishU.S. Virgin IslanderUgandanUkrainianUruguayanUteVenezuelanVietnameseWelshWest IndianYakamaYaquiYugoslavianYumanYup'ikZimbabwean
Immigration
NonimmigrantsImmigrantsAfghanistanAfricaAlbaniaArgentinaArmeniaAsiaAustraliaAustriaBahamasBangladeshBarbadosBelarusBelgiumBelizeBoliviaBosnia and HerzegovinaBrazilBulgariaBurma/MyanmarCabo VerdeCambodiaCameroonCanadaCaribbeanCentral AmericaChileChinaColombiaCongoCosta RicaCroatiaCubaCzechoslovakiaDenmarkDominicaDominican RepublicEastern AfricaEastern AsiaEastern EuropeEgyptEl SalvadorEnglandEritreaEthiopiaEuropeFijiFranceGermanyGhanaGreeceGrenadaGuatemalaGuyanaHaitiHondurasHong KongHungaryIndiaIndonesiaIranIraqIrelandIsraelItalyJamaicaJapanJordanKazakhstanKenyaKoreaKuwaitLaosLatin AmericaLatviaLebanonLiberiaLithuaniaMalaysiaMexicoMicronesiaMiddle AfricaMoldovaMoroccoNepalNetherlandsNicaraguaNigeriaNorth AmericaNorth MacedoniaNorthern AfricaNorthern EuropeNorwayOceaniaPakistanPanamaPeruPhilippinesPolandPortugalRomaniaRussiaSaudi ArabiaScotlandSenegalSerbiaSierra LeoneSingaporeSomaliaSouth AfricaSouth AmericaSouth Central AsiaSouth Eastern AsiaSouthern EuropeSpainSri LankaSt. Vincent and the GrenadinesSudanSwedenSwitzerlandSyriaTaiwanThailandTrinidad and TobagoTurkeyUgandaUkraineUruguayUzbekistanVenezuelaVietnamWest IndiesWestern AfricaWestern AsiaWestern EuropeYemenZaireZimbabweAzores
Immigrants from Ecuador
Race
Ancestry
AfghanAfricanAlaska NativeAlaskan AthabascanAlbanianAleutAlsatianAmericanApacheArabArapahoArgentineanArmenianAssyrian/Chaldean/SyriacAustralianAustrianBahamianBangladeshiBarbadianBasqueBelgianBelizeanBermudanBhutaneseBlackfeetBolivianBrazilianBritishBritish West IndianBulgarianBurmeseCajunCambodianCanadianCape VerdeanCarpatho RusynCelticCentral AmericanCentral American IndianCherokeeCheyenneChickasawChileanChineseChippewaChoctawColombianColvilleComancheCosta RicanCreeCreekCroatianCrowCubanCypriotCzechCzechoslovakianDanishDelawareDominicanDutchDutch West IndianEastern EuropeanEcuadorianEgyptianEnglishEstonianEthiopianEuropeanFijianFilipinoFinnishFrenchFrench American IndianFrench CanadianGermanGerman RussianGhanaianGreekGuamanian/ChamorroGuatemalanGuyaneseHaitianHmongHonduranHopiHoumaHungarianIcelanderIndian (Asian)IndonesianInupiatIranianIraqiIrishIroquoisIsraeliItalianJamaicanJapaneseJordanianKenyanKiowaKoreanLaotianLatvianLebaneseLiberianLithuanianLumbeeLuxembourgerMacedonianMalaysianMalteseMarshalleseMenomineeMexicanMexican American IndianMongolianMoroccanNative HawaiianNavajoNepaleseNew ZealanderNicaraguanNigerianNorthern EuropeanNorwegianOsageOttawaPaiutePakistaniPalestinianPanamanianParaguayanPennsylvania GermanPeruvianPimaPolishPortuguesePotawatomiPuebloPuerto RicanPuget Sound SalishRomanianRussianSalvadoranSamoanScandinavianScotch-IrishScottishSeminoleSenegaleseSerbianShoshoneSierra LeoneanSiouxSlavicSlovakSloveneSomaliSouth AfricanSouth AmericanSouth American IndianSoviet UnionSpaniardSpanishSpanish AmericanSpanish American IndianSri LankanSubsaharan AfricanSudaneseSwedishSwissSyrianTaiwaneseThaiTlingit-HaidaTohono O'OdhamTonganTrinidadian and TobagonianTsimshianTurkishU.S. Virgin IslanderUgandanUkrainianUruguayanUteVenezuelanVietnameseWelshWest IndianYakamaYaquiYugoslavianYumanYup'ikZimbabwean
Immigration
NonimmigrantsImmigrantsAfghanistanAfricaAlbaniaArgentinaArmeniaAsiaAustraliaAustriaBahamasBangladeshBarbadosBelarusBelgiumBelizeBoliviaBosnia and HerzegovinaBrazilBulgariaBurma/MyanmarCabo VerdeCambodiaCameroonCanadaCaribbeanCentral AmericaChileChinaColombiaCongoCosta RicaCroatiaCubaCzechoslovakiaDenmarkDominicaDominican RepublicEastern AfricaEastern AsiaEastern EuropeEcuadorEgyptEl SalvadorEnglandEritreaEthiopiaEuropeFijiFranceGermanyGhanaGreeceGrenadaGuatemalaGuyanaHaitiHondurasHong KongHungaryIndiaIndonesiaIranIraqIrelandIsraelItalyJamaicaJapanJordanKazakhstanKenyaKoreaKuwaitLaosLatin AmericaLatviaLebanonLiberiaLithuaniaMalaysiaMexicoMicronesiaMiddle AfricaMoldovaMoroccoNepalNetherlandsNicaraguaNigeriaNorth AmericaNorth MacedoniaNorthern AfricaNorthern EuropeNorwayOceaniaPakistanPanamaPeruPhilippinesPolandPortugalRomaniaRussiaSaudi ArabiaScotlandSenegalSerbiaSierra LeoneSingaporeSomaliaSouth AfricaSouth AmericaSouth Central AsiaSouth Eastern AsiaSouthern EuropeSpainSri LankaSt. Vincent and the GrenadinesSudanSwedenSwitzerlandSyriaTaiwanThailandTrinidad and TobagoTurkeyUgandaUkraineUruguayUzbekistanVenezuelaVietnamWest IndiesWestern AfricaWestern AsiaWestern EuropeYemenZaireZimbabweAzores
In Labor Force | Age > 16
Income
Poverty
Unemployment
Labor Participation
Family Structure
Vehicle Availability
Education Level
Disability

In Labor Force | Age > 16 Comparison

Okinawans

Immigrants from Ecuador

Exceptional
Exceptional
65.9%
IN LABOR FORCE | AGE > 16
98.7/ 100
METRIC RATING
100th/ 347
METRIC RANK
65.7%
IN LABOR FORCE | AGE > 16
95.9/ 100
METRIC RATING
122nd/ 347
METRIC RANK

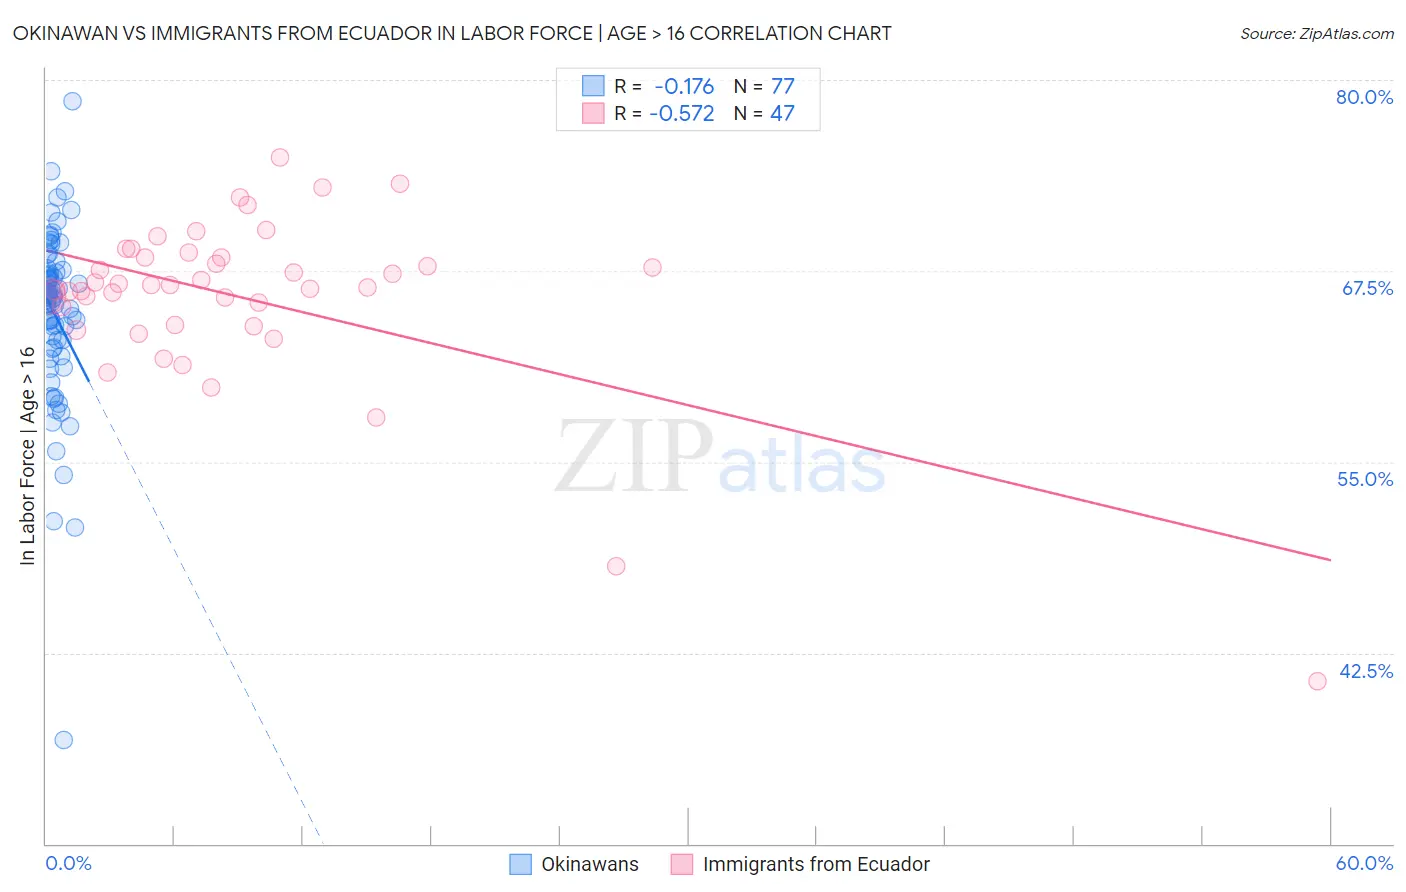
Okinawan vs Immigrants from Ecuador In Labor Force | Age > 16 Correlation Chart

The statistical analysis conducted on geographies consisting of 73,766,468 people shows a poor negative correlation between the proportion of Okinawans and labor force participation rate among population ages 16 and over in the United States with a correlation coefficient (R) of -0.176 and weighted average of 65.9%. Similarly, the statistical analysis conducted on geographies consisting of 271,016,720 people shows a substantial negative correlation between the proportion of Immigrants from Ecuador and labor force participation rate among population ages 16 and over in the United States with a correlation coefficient (R) of -0.572 and weighted average of 65.7%, a difference of 0.32%.
Okinawan vs Immigrants from Ecuador In Labor Force | Age > 16

In Labor Force | Age > 16 Correlation Summary

MeasurementOkinawanImmigrants from Ecuador
Minimum36.8%40.6%
Maximum78.6%75.0%
Range41.8%34.4%
Mean64.6%65.8%
Median65.7%66.6%
Interquartile 25% (IQ1)62.5%63.9%
Interquartile 75% (IQ3)67.5%68.4%
Interquartile Range (IQR)5.0%4.4%
Standard Deviation (Sample)5.8%5.7%
Standard Deviation (Population)5.8%5.7%

Similar Demographics by In Labor Force | Age > 16

Demographics Similar to Okinawans by In Labor Force | Age > 16

In terms of in labor force | age > 16, the demographic groups most similar to Okinawans are Immigrants from Australia (65.9%, a difference of 0.0%), Immigrants from Colombia (65.9%, a difference of 0.010%), Uruguayan (65.9%, a difference of 0.010%), Immigrants from Chile (65.9%, a difference of 0.020%), and Immigrants from South Eastern Asia (65.9%, a difference of 0.030%).
DemographicsRating | RankIn Labor Force | Age > 16
Immigrants | South America
99.1
/100
|
#93
Exceptional
66.0%
Immigrants | Cambodia
99.1
/100
|
#94
Exceptional
66.0%
Immigrants | Uruguay
99.1
/100
|
#95
Exceptional
66.0%
Bangladeshis
98.9
/100
|
#96
Exceptional
65.9%
Filipinos
98.9
/100
|
#97
Exceptional
65.9%
Immigrants | Chile
98.7
/100
|
#98
Exceptional
65.9%
Immigrants | Australia
98.7
/100
|
#99
Exceptional
65.9%
Okinawans
98.7
/100
|
#100
Exceptional
65.9%
Immigrants | Colombia
98.6
/100
|
#101
Exceptional
65.9%
Uruguayans
98.6
/100
|
#102
Exceptional
65.9%
Immigrants | South Eastern Asia
98.5
/100
|
#103
Exceptional
65.9%
Palestinians
98.5
/100
|
#104
Exceptional
65.9%
Colombians
98.4
/100
|
#105
Exceptional
65.9%
Immigrants | Serbia
98.1
/100
|
#106
Exceptional
65.8%
Immigrants | Poland
98.1
/100
|
#107
Exceptional
65.8%

Demographics Similar to Immigrants from Ecuador by In Labor Force | Age > 16

In terms of in labor force | age > 16, the demographic groups most similar to Immigrants from Ecuador are New Zealander (65.7%, a difference of 0.010%), Immigrants from Hong Kong (65.7%, a difference of 0.020%), Immigrants from Iraq (65.7%, a difference of 0.030%), Iraqi (65.7%, a difference of 0.030%), and Immigrants from France (65.7%, a difference of 0.040%).
DemographicsRating | RankIn Labor Force | Age > 16
Immigrants | Indonesia
96.8
/100
|
#115
Exceptional
65.7%
Argentineans
96.7
/100
|
#116
Exceptional
65.7%
Immigrants | Iran
96.6
/100
|
#117
Exceptional
65.7%
Immigrants | Thailand
96.6
/100
|
#118
Exceptional
65.7%
Immigrants | France
96.4
/100
|
#119
Exceptional
65.7%
Immigrants | Hong Kong
96.2
/100
|
#120
Exceptional
65.7%
New Zealanders
96.0
/100
|
#121
Exceptional
65.7%
Immigrants | Ecuador
95.9
/100
|
#122
Exceptional
65.7%
Immigrants | Iraq
95.5
/100
|
#123
Exceptional
65.7%
Iraqis
95.4
/100
|
#124
Exceptional
65.7%
Norwegians
95.3
/100
|
#125
Exceptional
65.7%
Koreans
95.3
/100
|
#126
Exceptional
65.7%
Immigrants | Eastern Asia
94.9
/100
|
#127
Exceptional
65.7%
Ecuadorians
94.7
/100
|
#128
Exceptional
65.6%
Immigrants | Philippines
94.5
/100
|
#129
Exceptional
65.6%