Norwegian vs Yugoslavian In Labor Force | Age 30-34

COMPARE

Norwegian
Race
Ancestry
AfghanAfricanAlaska NativeAlaskan AthabascanAlbanianAleutAlsatianAmericanApacheArabArapahoArgentineanArmenianAssyrian/Chaldean/SyriacAustralianAustrianBahamianBangladeshiBarbadianBasqueBelgianBelizeanBermudanBhutaneseBlackfeetBolivianBrazilianBritishBritish West IndianBulgarianBurmeseCajunCambodianCanadianCape VerdeanCarpatho RusynCelticCentral AmericanCentral American IndianCherokeeCheyenneChickasawChileanChineseChippewaChoctawColombianColvilleComancheCosta RicanCreeCreekCroatianCrowCubanCypriotCzechCzechoslovakianDanishDelawareDominicanDutchDutch West IndianEastern EuropeanEcuadorianEgyptianEnglishEstonianEthiopianEuropeanFijianFilipinoFinnishFrenchFrench American IndianFrench CanadianGermanGerman RussianGhanaianGreekGuamanian/ChamorroGuatemalanGuyaneseHaitianHmongHonduranHopiHoumaHungarianIcelanderIndian (Asian)IndonesianInupiatIranianIraqiIrishIroquoisIsraeliItalianJamaicanJapaneseJordanianKenyanKiowaKoreanLaotianLatvianLebaneseLiberianLithuanianLumbeeLuxembourgerMacedonianMalaysianMalteseMarshalleseMenomineeMexicanMexican American IndianMongolianMoroccanNative HawaiianNavajoNepaleseNew ZealanderNicaraguanNigerianNorthern EuropeanNorwegianOkinawanOsageOttawaPaiutePakistaniPalestinianPanamanianParaguayanPennsylvania GermanPeruvianPimaPolishPortuguesePotawatomiPuebloPuerto RicanPuget Sound SalishRomanianRussianSalvadoranSamoanScandinavianScotch-IrishScottishSeminoleSenegaleseSerbianShoshoneSierra LeoneanSiouxSlavicSlovakSloveneSomaliSouth AfricanSouth AmericanSouth American IndianSoviet UnionSpaniardSpanishSpanish AmericanSpanish American IndianSri LankanSubsaharan AfricanSudaneseSwedishSwissSyrianTaiwaneseThaiTlingit-HaidaTohono O'OdhamTonganTrinidadian and TobagonianTsimshianTurkishU.S. Virgin IslanderUgandanUkrainianUruguayanUteVenezuelanVietnameseWelshWest IndianYakamaYaquiYumanYup'ikZimbabwean
Immigration
NonimmigrantsImmigrantsAfghanistanAfricaAlbaniaArgentinaArmeniaAsiaAustraliaAustriaBahamasBangladeshBarbadosBelarusBelgiumBelizeBoliviaBosnia and HerzegovinaBrazilBulgariaBurma/MyanmarCabo VerdeCambodiaCameroonCanadaCaribbeanCentral AmericaChileChinaColombiaCongoCosta RicaCroatiaCubaCzechoslovakiaDenmarkDominicaDominican RepublicEastern AfricaEastern AsiaEastern EuropeEcuadorEgyptEl SalvadorEnglandEritreaEthiopiaEuropeFijiFranceGermanyGhanaGreeceGrenadaGuatemalaGuyanaHaitiHondurasHong KongHungaryIndiaIndonesiaIranIraqIrelandIsraelItalyJamaicaJapanJordanKazakhstanKenyaKoreaKuwaitLaosLatin AmericaLatviaLebanonLiberiaLithuaniaMalaysiaMexicoMicronesiaMiddle AfricaMoldovaMoroccoNepalNetherlandsNicaraguaNigeriaNorth AmericaNorth MacedoniaNorthern AfricaNorthern EuropeNorwayOceaniaPakistanPanamaPeruPhilippinesPolandPortugalRomaniaRussiaSaudi ArabiaScotlandSenegalSerbiaSierra LeoneSingaporeSomaliaSouth AfricaSouth AmericaSouth Central AsiaSouth Eastern AsiaSouthern EuropeSpainSri LankaSt. Vincent and the GrenadinesSudanSwedenSwitzerlandSyriaTaiwanThailandTrinidad and TobagoTurkeyUgandaUkraineUruguayUzbekistanVenezuelaVietnamWest IndiesWestern AfricaWestern AsiaWestern EuropeYemenZaireZimbabweAzores
Yugoslavian
Race
Ancestry
AfghanAfricanAlaska NativeAlaskan AthabascanAlbanianAleutAlsatianAmericanApacheArabArapahoArgentineanArmenianAssyrian/Chaldean/SyriacAustralianAustrianBahamianBangladeshiBarbadianBasqueBelgianBelizeanBermudanBhutaneseBlackfeetBolivianBrazilianBritishBritish West IndianBulgarianBurmeseCajunCambodianCanadianCape VerdeanCarpatho RusynCelticCentral AmericanCentral American IndianCherokeeCheyenneChickasawChileanChineseChippewaChoctawColombianColvilleComancheCosta RicanCreeCreekCroatianCrowCubanCypriotCzechCzechoslovakianDanishDelawareDominicanDutchDutch West IndianEastern EuropeanEcuadorianEgyptianEnglishEstonianEthiopianEuropeanFijianFilipinoFinnishFrenchFrench American IndianFrench CanadianGermanGerman RussianGhanaianGreekGuamanian/ChamorroGuatemalanGuyaneseHaitianHmongHonduranHopiHoumaHungarianIcelanderIndian (Asian)IndonesianInupiatIranianIraqiIrishIroquoisIsraeliItalianJamaicanJapaneseJordanianKenyanKiowaKoreanLaotianLatvianLebaneseLiberianLithuanianLumbeeLuxembourgerMacedonianMalaysianMalteseMarshalleseMenomineeMexicanMexican American IndianMongolianMoroccanNative HawaiianNavajoNepaleseNew ZealanderNicaraguanNigerianNorthern EuropeanOkinawanOsageOttawaPaiutePakistaniPalestinianPanamanianParaguayanPennsylvania GermanPeruvianPimaPolishPortuguesePotawatomiPuebloPuerto RicanPuget Sound SalishRomanianRussianSalvadoranSamoanScandinavianScotch-IrishScottishSeminoleSenegaleseSerbianShoshoneSierra LeoneanSiouxSlavicSlovakSloveneSomaliSouth AfricanSouth AmericanSouth American IndianSoviet UnionSpaniardSpanishSpanish AmericanSpanish American IndianSri LankanSubsaharan AfricanSudaneseSwedishSwissSyrianTaiwaneseThaiTlingit-HaidaTohono O'OdhamTonganTrinidadian and TobagonianTsimshianTurkishU.S. Virgin IslanderUgandanUkrainianUruguayanUteVenezuelanVietnameseWelshWest IndianYakamaYaquiYugoslavianYumanYup'ikZimbabwean
Immigration
NonimmigrantsImmigrantsAfghanistanAfricaAlbaniaArgentinaArmeniaAsiaAustraliaAustriaBahamasBangladeshBarbadosBelarusBelgiumBelizeBoliviaBosnia and HerzegovinaBrazilBulgariaBurma/MyanmarCabo VerdeCambodiaCameroonCanadaCaribbeanCentral AmericaChileChinaColombiaCongoCosta RicaCroatiaCubaCzechoslovakiaDenmarkDominicaDominican RepublicEastern AfricaEastern AsiaEastern EuropeEcuadorEgyptEl SalvadorEnglandEritreaEthiopiaEuropeFijiFranceGermanyGhanaGreeceGrenadaGuatemalaGuyanaHaitiHondurasHong KongHungaryIndiaIndonesiaIranIraqIrelandIsraelItalyJamaicaJapanJordanKazakhstanKenyaKoreaKuwaitLaosLatin AmericaLatviaLebanonLiberiaLithuaniaMalaysiaMexicoMicronesiaMiddle AfricaMoldovaMoroccoNepalNetherlandsNicaraguaNigeriaNorth AmericaNorth MacedoniaNorthern AfricaNorthern EuropeNorwayOceaniaPakistanPanamaPeruPhilippinesPolandPortugalRomaniaRussiaSaudi ArabiaScotlandSenegalSerbiaSierra LeoneSingaporeSomaliaSouth AfricaSouth AmericaSouth Central AsiaSouth Eastern AsiaSouthern EuropeSpainSri LankaSt. Vincent and the GrenadinesSudanSwedenSwitzerlandSyriaTaiwanThailandTrinidad and TobagoTurkeyUgandaUkraineUruguayUzbekistanVenezuelaVietnamWest IndiesWestern AfricaWestern AsiaWestern EuropeYemenZaireZimbabweAzores
In Labor Force | Age 30-34
Income
Poverty
Unemployment
Labor Participation
Family Structure
Vehicle Availability
Education Level
Disability

In Labor Force | Age 30-34 Comparison

Norwegians

Yugoslavians

Exceptional
Exceptional
85.7%
IN LABOR FORCE | AGE 30-34
99.9/ 100
METRIC RATING
37th/ 347
METRIC RANK
85.1%
IN LABOR FORCE | AGE 30-34
94.7/ 100
METRIC RATING
114th/ 347
METRIC RANK

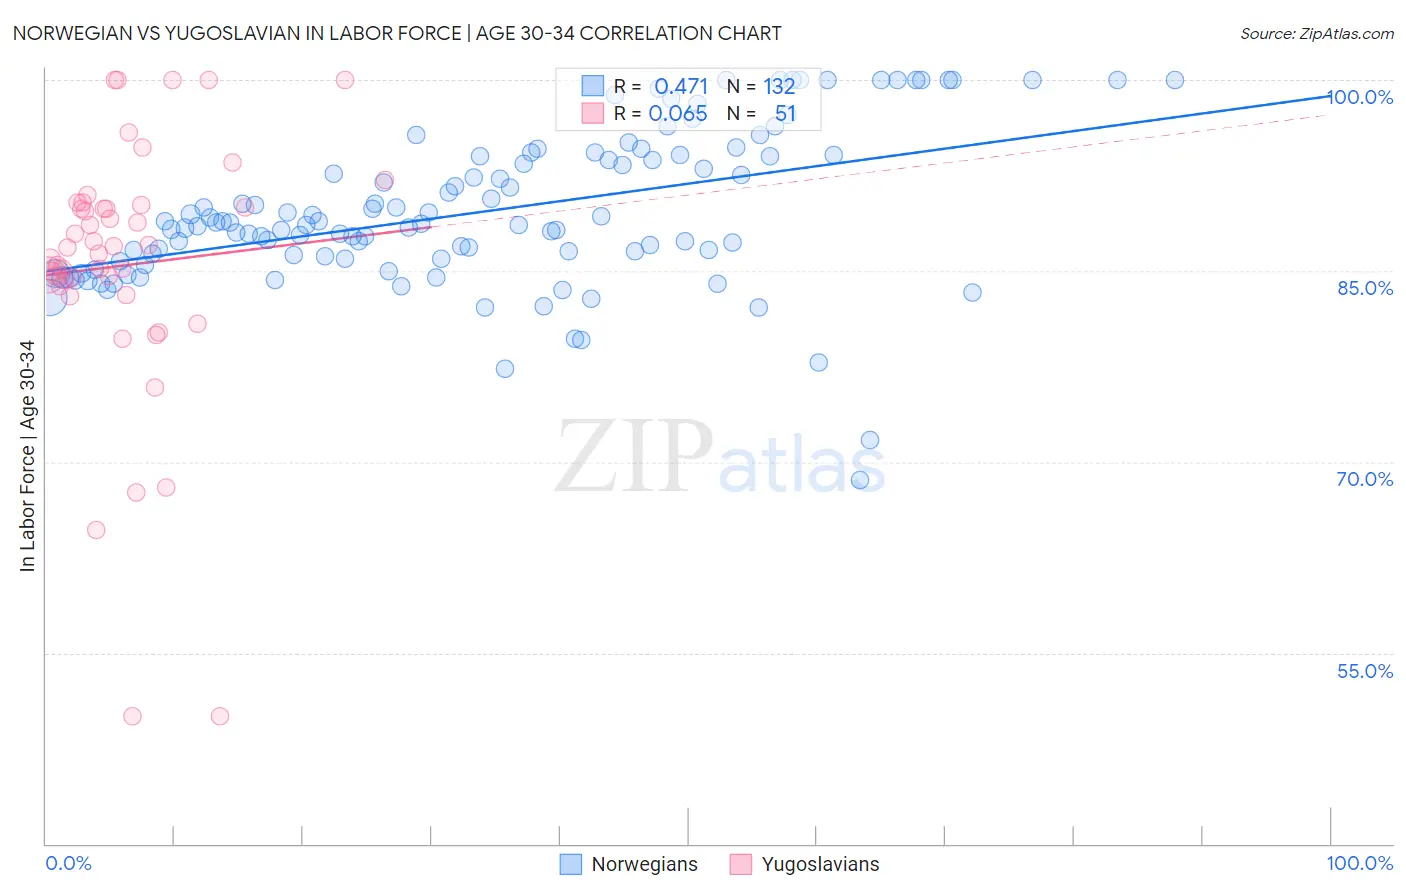
Norwegian vs Yugoslavian In Labor Force | Age 30-34 Correlation Chart

The statistical analysis conducted on geographies consisting of 532,518,250 people shows a moderate positive correlation between the proportion of Norwegians and labor force participation rate among population between the ages 30 and 34 in the United States with a correlation coefficient (R) of 0.471 and weighted average of 85.7%. Similarly, the statistical analysis conducted on geographies consisting of 285,635,237 people shows a slight positive correlation between the proportion of Yugoslavians and labor force participation rate among population between the ages 30 and 34 in the United States with a correlation coefficient (R) of 0.065 and weighted average of 85.1%, a difference of 0.74%.
Norwegian vs Yugoslavian In Labor Force | Age 30-34

In Labor Force | Age 30-34 Correlation Summary

MeasurementNorwegianYugoslavian
Minimum68.6%50.0%
Maximum100.0%100.0%
Range31.4%50.0%
Mean89.6%85.4%
Median88.7%86.8%
Interquartile 25% (IQ1)85.9%83.8%
Interquartile 75% (IQ3)94.0%90.2%
Interquartile Range (IQR)8.0%6.4%
Standard Deviation (Sample)6.0%10.4%
Standard Deviation (Population)6.0%10.3%

Similar Demographics by In Labor Force | Age 30-34

Demographics Similar to Norwegians by In Labor Force | Age 30-34

In terms of in labor force | age 30-34, the demographic groups most similar to Norwegians are Serbian (85.8%, a difference of 0.010%), Albanian (85.7%, a difference of 0.010%), Immigrants from Greece (85.7%, a difference of 0.010%), Immigrants from Bosnia and Herzegovina (85.8%, a difference of 0.020%), and Ugandan (85.8%, a difference of 0.020%).
DemographicsRating | RankIn Labor Force | Age 30-34
Immigrants | Hong Kong
100.0
/100
|
#30
Exceptional
85.8%
Paraguayans
99.9
/100
|
#31
Exceptional
85.8%
Cypriots
99.9
/100
|
#32
Exceptional
85.8%
Immigrants | Bosnia and Herzegovina
99.9
/100
|
#33
Exceptional
85.8%
Ugandans
99.9
/100
|
#34
Exceptional
85.8%
Serbians
99.9
/100
|
#35
Exceptional
85.8%
Albanians
99.9
/100
|
#36
Exceptional
85.7%
Norwegians
99.9
/100
|
#37
Exceptional
85.7%
Immigrants | Greece
99.9
/100
|
#38
Exceptional
85.7%
Eastern Europeans
99.9
/100
|
#39
Exceptional
85.7%
Turks
99.9
/100
|
#40
Exceptional
85.7%
Immigrants | Italy
99.9
/100
|
#41
Exceptional
85.7%
Zimbabweans
99.8
/100
|
#42
Exceptional
85.6%
Immigrants | Lithuania
99.8
/100
|
#43
Exceptional
85.6%
Immigrants | Sri Lanka
99.8
/100
|
#44
Exceptional
85.6%

Demographics Similar to Yugoslavians by In Labor Force | Age 30-34

In terms of in labor force | age 30-34, the demographic groups most similar to Yugoslavians are Immigrants from Hungary (85.1%, a difference of 0.0%), Immigrants from Romania (85.1%, a difference of 0.0%), Immigrants from South Central Asia (85.1%, a difference of 0.0%), Immigrants from Scotland (85.1%, a difference of 0.010%), and Egyptian (85.1%, a difference of 0.010%).
DemographicsRating | RankIn Labor Force | Age 30-34
Immigrants | Northern Africa
96.3
/100
|
#107
Exceptional
85.2%
Immigrants | Zimbabwe
95.8
/100
|
#108
Exceptional
85.1%
Argentineans
95.8
/100
|
#109
Exceptional
85.1%
Immigrants | South Africa
95.3
/100
|
#110
Exceptional
85.1%
Immigrants | Scotland
94.9
/100
|
#111
Exceptional
85.1%
Immigrants | Hungary
94.8
/100
|
#112
Exceptional
85.1%
Immigrants | Romania
94.7
/100
|
#113
Exceptional
85.1%
Yugoslavians
94.7
/100
|
#114
Exceptional
85.1%
Immigrants | South Central Asia
94.6
/100
|
#115
Exceptional
85.1%
Egyptians
94.5
/100
|
#116
Exceptional
85.1%
Immigrants | Denmark
94.3
/100
|
#117
Exceptional
85.1%
Immigrants | Malaysia
94.2
/100
|
#118
Exceptional
85.1%
Asians
93.4
/100
|
#119
Exceptional
85.1%
Immigrants | Southern Europe
93.3
/100
|
#120
Exceptional
85.1%
Immigrants | Egypt
93.2
/100
|
#121
Exceptional
85.1%