Norwegian vs Immigrants from Scotland In Labor Force | Age 16-19

COMPARE

Norwegian
Race
Ancestry
AfghanAfricanAlaska NativeAlaskan AthabascanAlbanianAleutAlsatianAmericanApacheArabArapahoArgentineanArmenianAssyrian/Chaldean/SyriacAustralianAustrianBahamianBangladeshiBarbadianBasqueBelgianBelizeanBermudanBhutaneseBlackfeetBolivianBrazilianBritishBritish West IndianBulgarianBurmeseCajunCambodianCanadianCape VerdeanCarpatho RusynCelticCentral AmericanCentral American IndianCherokeeCheyenneChickasawChileanChineseChippewaChoctawColombianColvilleComancheCosta RicanCreeCreekCroatianCrowCubanCypriotCzechCzechoslovakianDanishDelawareDominicanDutchDutch West IndianEastern EuropeanEcuadorianEgyptianEnglishEstonianEthiopianEuropeanFijianFilipinoFinnishFrenchFrench American IndianFrench CanadianGermanGerman RussianGhanaianGreekGuamanian/ChamorroGuatemalanGuyaneseHaitianHmongHonduranHopiHoumaHungarianIcelanderIndian (Asian)IndonesianInupiatIranianIraqiIrishIroquoisIsraeliItalianJamaicanJapaneseJordanianKenyanKiowaKoreanLaotianLatvianLebaneseLiberianLithuanianLumbeeLuxembourgerMacedonianMalaysianMalteseMarshalleseMenomineeMexicanMexican American IndianMongolianMoroccanNative HawaiianNavajoNepaleseNew ZealanderNicaraguanNigerianNorthern EuropeanNorwegianOkinawanOsageOttawaPaiutePakistaniPalestinianPanamanianParaguayanPennsylvania GermanPeruvianPimaPolishPortuguesePotawatomiPuebloPuerto RicanPuget Sound SalishRomanianRussianSalvadoranSamoanScandinavianScotch-IrishScottishSeminoleSenegaleseSerbianShoshoneSierra LeoneanSiouxSlavicSlovakSloveneSomaliSouth AfricanSouth AmericanSouth American IndianSoviet UnionSpaniardSpanishSpanish AmericanSpanish American IndianSri LankanSubsaharan AfricanSudaneseSwedishSwissSyrianTaiwaneseThaiTlingit-HaidaTohono O'OdhamTonganTrinidadian and TobagonianTsimshianTurkishU.S. Virgin IslanderUgandanUkrainianUruguayanUteVenezuelanVietnameseWelshWest IndianYakamaYaquiYugoslavianYumanYup'ikZimbabwean
Immigration
NonimmigrantsImmigrantsAfghanistanAfricaAlbaniaArgentinaArmeniaAsiaAustraliaAustriaBahamasBangladeshBarbadosBelarusBelgiumBelizeBoliviaBosnia and HerzegovinaBrazilBulgariaBurma/MyanmarCabo VerdeCambodiaCameroonCanadaCaribbeanCentral AmericaChileChinaColombiaCongoCosta RicaCroatiaCubaCzechoslovakiaDenmarkDominicaDominican RepublicEastern AfricaEastern AsiaEastern EuropeEcuadorEgyptEl SalvadorEnglandEritreaEthiopiaEuropeFijiFranceGermanyGhanaGreeceGrenadaGuatemalaGuyanaHaitiHondurasHong KongHungaryIndiaIndonesiaIranIraqIrelandIsraelItalyJamaicaJapanJordanKazakhstanKenyaKoreaKuwaitLaosLatin AmericaLatviaLebanonLiberiaLithuaniaMalaysiaMexicoMicronesiaMiddle AfricaMoldovaMoroccoNepalNetherlandsNicaraguaNigeriaNorth AmericaNorth MacedoniaNorthern AfricaNorthern EuropeNorwayOceaniaPakistanPanamaPeruPhilippinesPolandPortugalRomaniaRussiaSaudi ArabiaSenegalSerbiaSierra LeoneSingaporeSomaliaSouth AfricaSouth AmericaSouth Central AsiaSouth Eastern AsiaSouthern EuropeSpainSri LankaSt. Vincent and the GrenadinesSudanSwedenSwitzerlandSyriaTaiwanThailandTrinidad and TobagoTurkeyUgandaUkraineUruguayUzbekistanVenezuelaVietnamWest IndiesWestern AfricaWestern AsiaWestern EuropeYemenZaireZimbabweAzores
Immigrants from Scotland
Race
Ancestry
AfghanAfricanAlaska NativeAlaskan AthabascanAlbanianAleutAlsatianAmericanApacheArabArapahoArgentineanArmenianAssyrian/Chaldean/SyriacAustralianAustrianBahamianBangladeshiBarbadianBasqueBelgianBelizeanBermudanBhutaneseBlackfeetBolivianBrazilianBritishBritish West IndianBulgarianBurmeseCajunCambodianCanadianCape VerdeanCarpatho RusynCelticCentral AmericanCentral American IndianCherokeeCheyenneChickasawChileanChineseChippewaChoctawColombianColvilleComancheCosta RicanCreeCreekCroatianCrowCubanCypriotCzechCzechoslovakianDanishDelawareDominicanDutchDutch West IndianEastern EuropeanEcuadorianEgyptianEnglishEstonianEthiopianEuropeanFijianFilipinoFinnishFrenchFrench American IndianFrench CanadianGermanGerman RussianGhanaianGreekGuamanian/ChamorroGuatemalanGuyaneseHaitianHmongHonduranHopiHoumaHungarianIcelanderIndian (Asian)IndonesianInupiatIranianIraqiIrishIroquoisIsraeliItalianJamaicanJapaneseJordanianKenyanKiowaKoreanLaotianLatvianLebaneseLiberianLithuanianLumbeeLuxembourgerMacedonianMalaysianMalteseMarshalleseMenomineeMexicanMexican American IndianMongolianMoroccanNative HawaiianNavajoNepaleseNew ZealanderNicaraguanNigerianNorthern EuropeanOkinawanOsageOttawaPaiutePakistaniPalestinianPanamanianParaguayanPennsylvania GermanPeruvianPimaPolishPortuguesePotawatomiPuebloPuerto RicanPuget Sound SalishRomanianRussianSalvadoranSamoanScandinavianScotch-IrishScottishSeminoleSenegaleseSerbianShoshoneSierra LeoneanSiouxSlavicSlovakSloveneSomaliSouth AfricanSouth AmericanSouth American IndianSoviet UnionSpaniardSpanishSpanish AmericanSpanish American IndianSri LankanSubsaharan AfricanSudaneseSwedishSwissSyrianTaiwaneseThaiTlingit-HaidaTohono O'OdhamTonganTrinidadian and TobagonianTsimshianTurkishU.S. Virgin IslanderUgandanUkrainianUruguayanUteVenezuelanVietnameseWelshWest IndianYakamaYaquiYugoslavianYumanYup'ikZimbabwean
Immigration
NonimmigrantsImmigrantsAfghanistanAfricaAlbaniaArgentinaArmeniaAsiaAustraliaAustriaBahamasBangladeshBarbadosBelarusBelgiumBelizeBoliviaBosnia and HerzegovinaBrazilBulgariaBurma/MyanmarCabo VerdeCambodiaCameroonCanadaCaribbeanCentral AmericaChileChinaColombiaCongoCosta RicaCroatiaCubaCzechoslovakiaDenmarkDominicaDominican RepublicEastern AfricaEastern AsiaEastern EuropeEcuadorEgyptEl SalvadorEnglandEritreaEthiopiaEuropeFijiFranceGermanyGhanaGreeceGrenadaGuatemalaGuyanaHaitiHondurasHong KongHungaryIndiaIndonesiaIranIraqIrelandIsraelItalyJamaicaJapanJordanKazakhstanKenyaKoreaKuwaitLaosLatin AmericaLatviaLebanonLiberiaLithuaniaMalaysiaMexicoMicronesiaMiddle AfricaMoldovaMoroccoNepalNetherlandsNicaraguaNigeriaNorth AmericaNorth MacedoniaNorthern AfricaNorthern EuropeNorwayOceaniaPakistanPanamaPeruPhilippinesPolandPortugalRomaniaRussiaSaudi ArabiaScotlandSenegalSerbiaSierra LeoneSingaporeSomaliaSouth AfricaSouth AmericaSouth Central AsiaSouth Eastern AsiaSouthern EuropeSpainSri LankaSt. Vincent and the GrenadinesSudanSwedenSwitzerlandSyriaTaiwanThailandTrinidad and TobagoTurkeyUgandaUkraineUruguayUzbekistanVenezuelaVietnamWest IndiesWestern AfricaWestern AsiaWestern EuropeYemenZaireZimbabweAzores
In Labor Force | Age 16-19
Income
Poverty
Unemployment
Labor Participation
Family Structure
Vehicle Availability
Education Level
Disability

In Labor Force | Age 16-19 Comparison

Norwegians

Immigrants from Scotland

Exceptional
Exceptional
46.2%
IN LABOR FORCE | AGE 16-19
100.0/ 100
METRIC RATING
2nd/ 347
METRIC RANK
38.5%
IN LABOR FORCE | AGE 16-19
98.5/ 100
METRIC RATING
112th/ 347
METRIC RANK

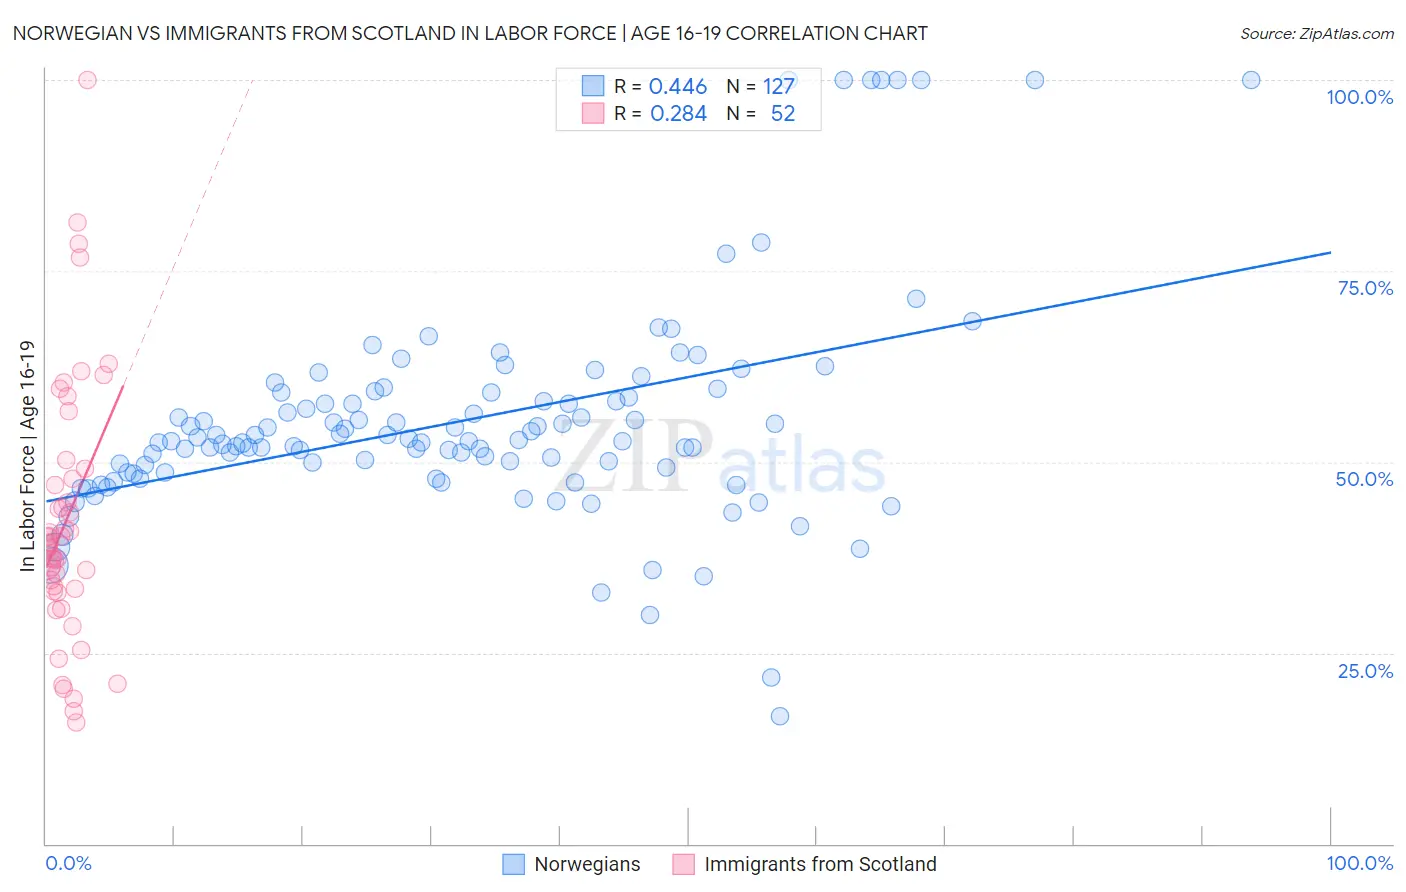
Norwegian vs Immigrants from Scotland In Labor Force | Age 16-19 Correlation Chart

The statistical analysis conducted on geographies consisting of 530,724,351 people shows a moderate positive correlation between the proportion of Norwegians and labor force participation rate among population between the ages 16 and 19 in the United States with a correlation coefficient (R) of 0.446 and weighted average of 46.2%. Similarly, the statistical analysis conducted on geographies consisting of 196,210,607 people shows a weak positive correlation between the proportion of Immigrants from Scotland and labor force participation rate among population between the ages 16 and 19 in the United States with a correlation coefficient (R) of 0.284 and weighted average of 38.5%, a difference of 20.0%.
Norwegian vs Immigrants from Scotland In Labor Force | Age 16-19

In Labor Force | Age 16-19 Correlation Summary

MeasurementNorwegianImmigrants from Scotland
Minimum16.7%15.9%
Maximum100.0%100.0%
Range83.3%84.1%
Mean55.4%42.4%
Median52.8%39.3%
Interquartile 25% (IQ1)48.6%33.2%
Interquartile 75% (IQ3)59.1%48.5%
Interquartile Range (IQR)10.5%15.3%
Standard Deviation (Sample)14.6%17.1%
Standard Deviation (Population)14.6%16.9%

Similar Demographics by In Labor Force | Age 16-19

Demographics Similar to Norwegians by In Labor Force | Age 16-19

In terms of in labor force | age 16-19, the demographic groups most similar to Norwegians are Pennsylvania German (46.4%, a difference of 0.56%), Immigrants from Somalia (45.6%, a difference of 1.3%), Luxembourger (45.3%, a difference of 2.0%), Alaskan Athabascan (45.2%, a difference of 2.2%), and Somali (45.1%, a difference of 2.4%).
DemographicsRating | RankIn Labor Force | Age 16-19
Pennsylvania Germans
100.0
/100
|
#1
Exceptional
46.4%
Norwegians
100.0
/100
|
#2
Exceptional
46.2%
Immigrants | Somalia
100.0
/100
|
#3
Exceptional
45.6%
Luxembourgers
100.0
/100
|
#4
Exceptional
45.3%
Alaskan Athabascans
100.0
/100
|
#5
Exceptional
45.2%
Somalis
100.0
/100
|
#6
Exceptional
45.1%
Danes
100.0
/100
|
#7
Exceptional
44.7%
Immigrants | Cabo Verde
100.0
/100
|
#8
Exceptional
44.7%
Cape Verdeans
100.0
/100
|
#9
Exceptional
44.5%
Germans
100.0
/100
|
#10
Exceptional
44.2%
Swedes
100.0
/100
|
#11
Exceptional
44.1%
Finns
100.0
/100
|
#12
Exceptional
43.9%
Dutch
100.0
/100
|
#13
Exceptional
43.8%
Chippewa
100.0
/100
|
#14
Exceptional
43.8%
Slovenes
100.0
/100
|
#15
Exceptional
43.7%

Demographics Similar to Immigrants from Scotland by In Labor Force | Age 16-19

In terms of in labor force | age 16-19, the demographic groups most similar to Immigrants from Scotland are Crow (38.5%, a difference of 0.010%), Maltese (38.5%, a difference of 0.070%), Subsaharan African (38.4%, a difference of 0.13%), Lebanese (38.6%, a difference of 0.19%), and Immigrants from Ethiopia (38.6%, a difference of 0.20%).
DemographicsRating | RankIn Labor Force | Age 16-19
Iraqis
98.9
/100
|
#105
Exceptional
38.6%
Delaware
98.8
/100
|
#106
Exceptional
38.6%
Chinese
98.8
/100
|
#107
Exceptional
38.6%
Immigrants | Ethiopia
98.7
/100
|
#108
Exceptional
38.6%
Lebanese
98.7
/100
|
#109
Exceptional
38.6%
Maltese
98.6
/100
|
#110
Exceptional
38.5%
Crow
98.5
/100
|
#111
Exceptional
38.5%
Immigrants | Scotland
98.5
/100
|
#112
Exceptional
38.5%
Sub-Saharan Africans
98.3
/100
|
#113
Exceptional
38.4%
Hawaiians
98.2
/100
|
#114
Exceptional
38.4%
Bulgarians
97.9
/100
|
#115
Exceptional
38.3%
Colville
97.9
/100
|
#116
Exceptional
38.3%
Chickasaw
97.8
/100
|
#117
Exceptional
38.3%
Immigrants | Nepal
97.8
/100
|
#118
Exceptional
38.3%
Assyrians/Chaldeans/Syriacs
97.8
/100
|
#119
Exceptional
38.3%