Nigerian vs Central American Indian In Labor Force | Age 30-34
COMPARE
Nigerian
Central American Indian
In Labor Force | Age 30-34
In Labor Force | Age 30-34 Comparison
Nigerians
Central American Indians
84.5%
IN LABOR FORCE | AGE 30-34
28.9/ 100
METRIC RATING
189th/ 347
METRIC RANK
83.0%
IN LABOR FORCE | AGE 30-34
0.0/ 100
METRIC RATING
288th/ 347
METRIC RANK
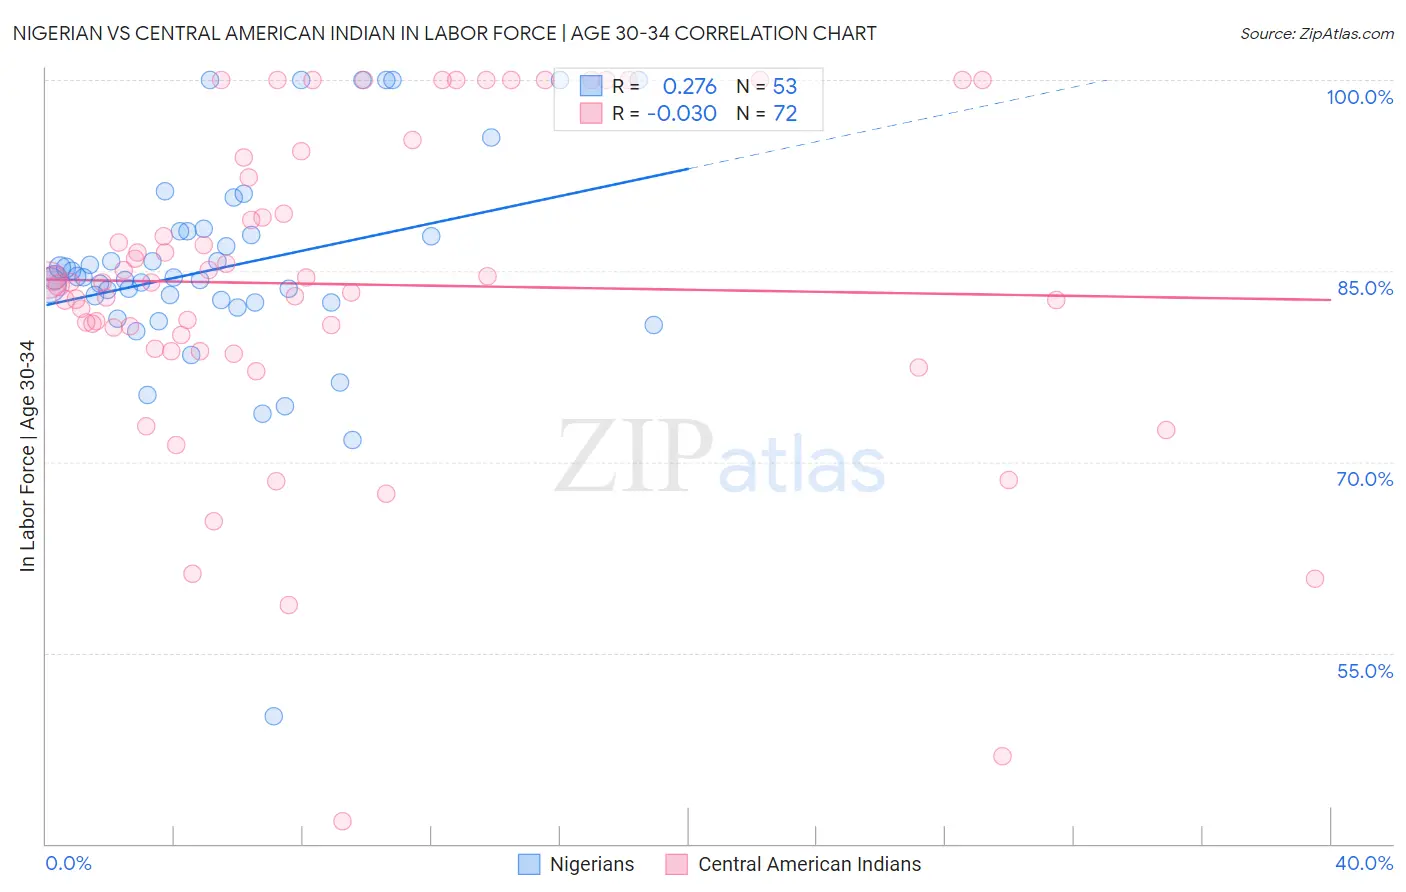
Nigerian vs Central American Indian In Labor Force | Age 30-34 Correlation Chart
The statistical analysis conducted on geographies consisting of 332,575,252 people shows a weak positive correlation between the proportion of Nigerians and labor force participation rate among population between the ages 30 and 34 in the United States with a correlation coefficient (R) of 0.276 and weighted average of 84.5%. Similarly, the statistical analysis conducted on geographies consisting of 326,063,674 people shows no correlation between the proportion of Central American Indians and labor force participation rate among population between the ages 30 and 34 in the United States with a correlation coefficient (R) of -0.030 and weighted average of 83.0%, a difference of 1.8%.
In Labor Force | Age 30-34 Correlation Summary
| Measurement | Nigerian | Central American Indian |
| Minimum | 50.0% | 41.8% |
| Maximum | 100.0% | 100.0% |
| Range | 50.0% | 58.2% |
| Mean | 85.3% | 84.0% |
| Median | 84.5% | 84.1% |
| Interquartile 25% (IQ1) | 82.5% | 79.5% |
| Interquartile 75% (IQ3) | 88.1% | 93.1% |
| Interquartile Range (IQR) | 5.6% | 13.6% |
| Standard Deviation (Sample) | 8.6% | 12.5% |
| Standard Deviation (Population) | 8.5% | 12.4% |
Similar Demographics by In Labor Force | Age 30-34
Demographics Similar to Nigerians by In Labor Force | Age 30-34
In terms of in labor force | age 30-34, the demographic groups most similar to Nigerians are Taiwanese (84.6%, a difference of 0.0%), Immigrants from Congo (84.6%, a difference of 0.010%), Costa Rican (84.6%, a difference of 0.010%), Immigrants from Philippines (84.6%, a difference of 0.020%), and Immigrants from Zaire (84.5%, a difference of 0.030%).
| Demographics | Rating | Rank | In Labor Force | Age 30-34 |
| Barbadians | 36.7 /100 | #182 | Fair 84.6% |
| Immigrants | Canada | 35.0 /100 | #183 | Fair 84.6% |
| Immigrants | North America | 33.3 /100 | #184 | Fair 84.6% |
| Immigrants | Philippines | 31.5 /100 | #185 | Fair 84.6% |
| Immigrants | Congo | 29.7 /100 | #186 | Fair 84.6% |
| Costa Ricans | 29.6 /100 | #187 | Fair 84.6% |
| Taiwanese | 29.4 /100 | #188 | Fair 84.6% |
| Nigerians | 28.9 /100 | #189 | Fair 84.5% |
| Immigrants | Zaire | 25.8 /100 | #190 | Fair 84.5% |
| Hungarians | 24.8 /100 | #191 | Fair 84.5% |
| Scandinavians | 24.7 /100 | #192 | Fair 84.5% |
| Immigrants | Costa Rica | 23.9 /100 | #193 | Fair 84.5% |
| Immigrants | Afghanistan | 23.5 /100 | #194 | Fair 84.5% |
| Koreans | 23.2 /100 | #195 | Fair 84.5% |
| British | 22.9 /100 | #196 | Fair 84.5% |
Demographics Similar to Central American Indians by In Labor Force | Age 30-34
In terms of in labor force | age 30-34, the demographic groups most similar to Central American Indians are Hawaiian (83.0%, a difference of 0.020%), Native Hawaiian (83.0%, a difference of 0.030%), Immigrants from Latin America (83.1%, a difference of 0.14%), Immigrants from Belize (83.2%, a difference of 0.20%), and Cree (83.2%, a difference of 0.20%).
| Demographics | Rating | Rank | In Labor Force | Age 30-34 |
| Samoans | 0.0 /100 | #281 | Tragic 83.3% |
| Mexican American Indians | 0.0 /100 | #282 | Tragic 83.2% |
| Assyrians/Chaldeans/Syriacs | 0.0 /100 | #283 | Tragic 83.2% |
| Immigrants | Belize | 0.0 /100 | #284 | Tragic 83.2% |
| Cree | 0.0 /100 | #285 | Tragic 83.2% |
| Immigrants | Latin America | 0.0 /100 | #286 | Tragic 83.1% |
| Native Hawaiians | 0.0 /100 | #287 | Tragic 83.0% |
| Central American Indians | 0.0 /100 | #288 | Tragic 83.0% |
| Hawaiians | 0.0 /100 | #289 | Tragic 83.0% |
| Blackfeet | 0.0 /100 | #290 | Tragic 82.8% |
| Potawatomi | 0.0 /100 | #291 | Tragic 82.8% |
| Blacks/African Americans | 0.0 /100 | #292 | Tragic 82.8% |
| Nepalese | 0.0 /100 | #293 | Tragic 82.7% |
| Americans | 0.0 /100 | #294 | Tragic 82.7% |
| Pennsylvania Germans | 0.0 /100 | #295 | Tragic 82.6% |