Native/Alaskan vs Immigrants from Syria In Labor Force | Age 35-44

COMPARE

Native/Alaskan
Race
Ancestry
AfghanAfricanAlaska NativeAlaskan AthabascanAlbanianAleutAlsatianAmericanApacheArabArapahoArgentineanArmenianAssyrian/Chaldean/SyriacAustralianAustrianBahamianBangladeshiBarbadianBasqueBelgianBelizeanBermudanBhutaneseBlackfeetBolivianBrazilianBritishBritish West IndianBulgarianBurmeseCajunCambodianCanadianCape VerdeanCarpatho RusynCelticCentral AmericanCentral American IndianCherokeeCheyenneChickasawChileanChineseChippewaChoctawColombianColvilleComancheCosta RicanCreeCreekCroatianCrowCubanCypriotCzechCzechoslovakianDanishDelawareDominicanDutchDutch West IndianEastern EuropeanEcuadorianEgyptianEnglishEstonianEthiopianEuropeanFijianFilipinoFinnishFrenchFrench American IndianFrench CanadianGermanGerman RussianGhanaianGreekGuamanian/ChamorroGuatemalanGuyaneseHaitianHmongHonduranHopiHoumaHungarianIcelanderIndian (Asian)IndonesianInupiatIranianIraqiIrishIroquoisIsraeliItalianJamaicanJapaneseJordanianKenyanKiowaKoreanLaotianLatvianLebaneseLiberianLithuanianLumbeeLuxembourgerMacedonianMalaysianMalteseMarshalleseMenomineeMexicanMexican American IndianMongolianMoroccanNative HawaiianNavajoNepaleseNew ZealanderNicaraguanNigerianNorthern EuropeanNorwegianOkinawanOsageOttawaPaiutePakistaniPalestinianPanamanianParaguayanPennsylvania GermanPeruvianPimaPolishPortuguesePotawatomiPuebloPuerto RicanPuget Sound SalishRomanianRussianSalvadoranSamoanScandinavianScotch-IrishScottishSeminoleSenegaleseSerbianShoshoneSierra LeoneanSiouxSlavicSlovakSloveneSomaliSouth AfricanSouth AmericanSouth American IndianSoviet UnionSpaniardSpanishSpanish AmericanSpanish American IndianSri LankanSubsaharan AfricanSudaneseSwedishSwissSyrianTaiwaneseThaiTlingit-HaidaTohono O'OdhamTonganTrinidadian and TobagonianTsimshianTurkishU.S. Virgin IslanderUgandanUkrainianUruguayanUteVenezuelanVietnameseWelshWest IndianYakamaYaquiYugoslavianYumanYup'ikZimbabwean
Immigration
NonimmigrantsImmigrantsAfghanistanAfricaAlbaniaArgentinaArmeniaAsiaAustraliaAustriaBahamasBangladeshBarbadosBelarusBelgiumBelizeBoliviaBosnia and HerzegovinaBrazilBulgariaBurma/MyanmarCabo VerdeCambodiaCameroonCanadaCaribbeanCentral AmericaChileChinaColombiaCongoCosta RicaCroatiaCubaCzechoslovakiaDenmarkDominicaDominican RepublicEastern AfricaEastern AsiaEastern EuropeEcuadorEgyptEl SalvadorEnglandEritreaEthiopiaEuropeFijiFranceGermanyGhanaGreeceGrenadaGuatemalaGuyanaHaitiHondurasHong KongHungaryIndiaIndonesiaIranIraqIrelandIsraelItalyJamaicaJapanJordanKazakhstanKenyaKoreaKuwaitLaosLatin AmericaLatviaLebanonLiberiaLithuaniaMalaysiaMexicoMicronesiaMiddle AfricaMoldovaMoroccoNepalNetherlandsNicaraguaNigeriaNorth AmericaNorth MacedoniaNorthern AfricaNorthern EuropeNorwayOceaniaPakistanPanamaPeruPhilippinesPolandPortugalRomaniaRussiaSaudi ArabiaScotlandSenegalSerbiaSierra LeoneSingaporeSomaliaSouth AfricaSouth AmericaSouth Central AsiaSouth Eastern AsiaSouthern EuropeSpainSri LankaSt. Vincent and the GrenadinesSudanSwedenSwitzerlandTaiwanThailandTrinidad and TobagoTurkeyUgandaUkraineUruguayUzbekistanVenezuelaVietnamWest IndiesWestern AfricaWestern AsiaWestern EuropeYemenZaireZimbabweAzores
Immigrants from Syria
Race
Ancestry
AfghanAfricanAlaska NativeAlaskan AthabascanAlbanianAleutAlsatianAmericanApacheArabArapahoArgentineanArmenianAssyrian/Chaldean/SyriacAustralianAustrianBahamianBangladeshiBarbadianBasqueBelgianBelizeanBermudanBhutaneseBlackfeetBolivianBrazilianBritishBritish West IndianBulgarianBurmeseCajunCambodianCanadianCape VerdeanCarpatho RusynCelticCentral AmericanCentral American IndianCherokeeCheyenneChickasawChileanChineseChippewaChoctawColombianColvilleComancheCosta RicanCreeCreekCroatianCrowCubanCypriotCzechCzechoslovakianDanishDelawareDominicanDutchDutch West IndianEastern EuropeanEcuadorianEgyptianEnglishEstonianEthiopianEuropeanFijianFilipinoFinnishFrenchFrench American IndianFrench CanadianGermanGerman RussianGhanaianGreekGuamanian/ChamorroGuatemalanGuyaneseHaitianHmongHonduranHopiHoumaHungarianIcelanderIndian (Asian)IndonesianInupiatIranianIraqiIrishIroquoisIsraeliItalianJamaicanJapaneseJordanianKenyanKiowaKoreanLaotianLatvianLebaneseLiberianLithuanianLumbeeLuxembourgerMacedonianMalaysianMalteseMarshalleseMenomineeMexicanMexican American IndianMongolianMoroccanNative HawaiianNavajoNepaleseNew ZealanderNicaraguanNigerianNorthern EuropeanNorwegianOkinawanOsageOttawaPaiutePakistaniPalestinianPanamanianParaguayanPennsylvania GermanPeruvianPimaPolishPortuguesePotawatomiPuebloPuerto RicanPuget Sound SalishRomanianRussianSalvadoranSamoanScandinavianScotch-IrishScottishSeminoleSenegaleseSerbianShoshoneSierra LeoneanSiouxSlavicSlovakSloveneSomaliSouth AfricanSouth AmericanSouth American IndianSoviet UnionSpaniardSpanishSpanish AmericanSpanish American IndianSri LankanSubsaharan AfricanSudaneseSwedishSwissSyrianTaiwaneseThaiTlingit-HaidaTohono O'OdhamTonganTrinidadian and TobagonianTsimshianTurkishU.S. Virgin IslanderUgandanUkrainianUruguayanUteVenezuelanVietnameseWelshWest IndianYakamaYaquiYugoslavianYumanYup'ikZimbabwean
Immigration
NonimmigrantsImmigrantsAfghanistanAfricaAlbaniaArgentinaArmeniaAsiaAustraliaAustriaBahamasBangladeshBarbadosBelarusBelgiumBelizeBoliviaBosnia and HerzegovinaBrazilBulgariaBurma/MyanmarCabo VerdeCambodiaCameroonCanadaCaribbeanCentral AmericaChileChinaColombiaCongoCosta RicaCroatiaCubaCzechoslovakiaDenmarkDominicaDominican RepublicEastern AfricaEastern AsiaEastern EuropeEcuadorEgyptEl SalvadorEnglandEritreaEthiopiaEuropeFijiFranceGermanyGhanaGreeceGrenadaGuatemalaGuyanaHaitiHondurasHong KongHungaryIndiaIndonesiaIranIraqIrelandIsraelItalyJamaicaJapanJordanKazakhstanKenyaKoreaKuwaitLaosLatin AmericaLatviaLebanonLiberiaLithuaniaMalaysiaMexicoMicronesiaMiddle AfricaMoldovaMoroccoNepalNetherlandsNicaraguaNigeriaNorth AmericaNorth MacedoniaNorthern AfricaNorthern EuropeNorwayOceaniaPakistanPanamaPeruPhilippinesPolandPortugalRomaniaRussiaSaudi ArabiaScotlandSenegalSerbiaSierra LeoneSingaporeSomaliaSouth AfricaSouth AmericaSouth Central AsiaSouth Eastern AsiaSouthern EuropeSpainSri LankaSt. Vincent and the GrenadinesSudanSwedenSwitzerlandSyriaTaiwanThailandTrinidad and TobagoTurkeyUgandaUkraineUruguayUzbekistanVenezuelaVietnamWest IndiesWestern AfricaWestern AsiaWestern EuropeYemenZaireZimbabweAzores
In Labor Force | Age 35-44
Income
Poverty
Unemployment
Labor Participation
Family Structure
Vehicle Availability
Education Level
Disability

In Labor Force | Age 35-44 Comparison

Natives/Alaskans

Immigrants from Syria

Tragic
Tragic
78.9%
IN LABOR FORCE | AGE 35-44
0.0/ 100
METRIC RATING
335th/ 347
METRIC RANK
83.9%
IN LABOR FORCE | AGE 35-44
2.5/ 100
METRIC RATING
235th/ 347
METRIC RANK

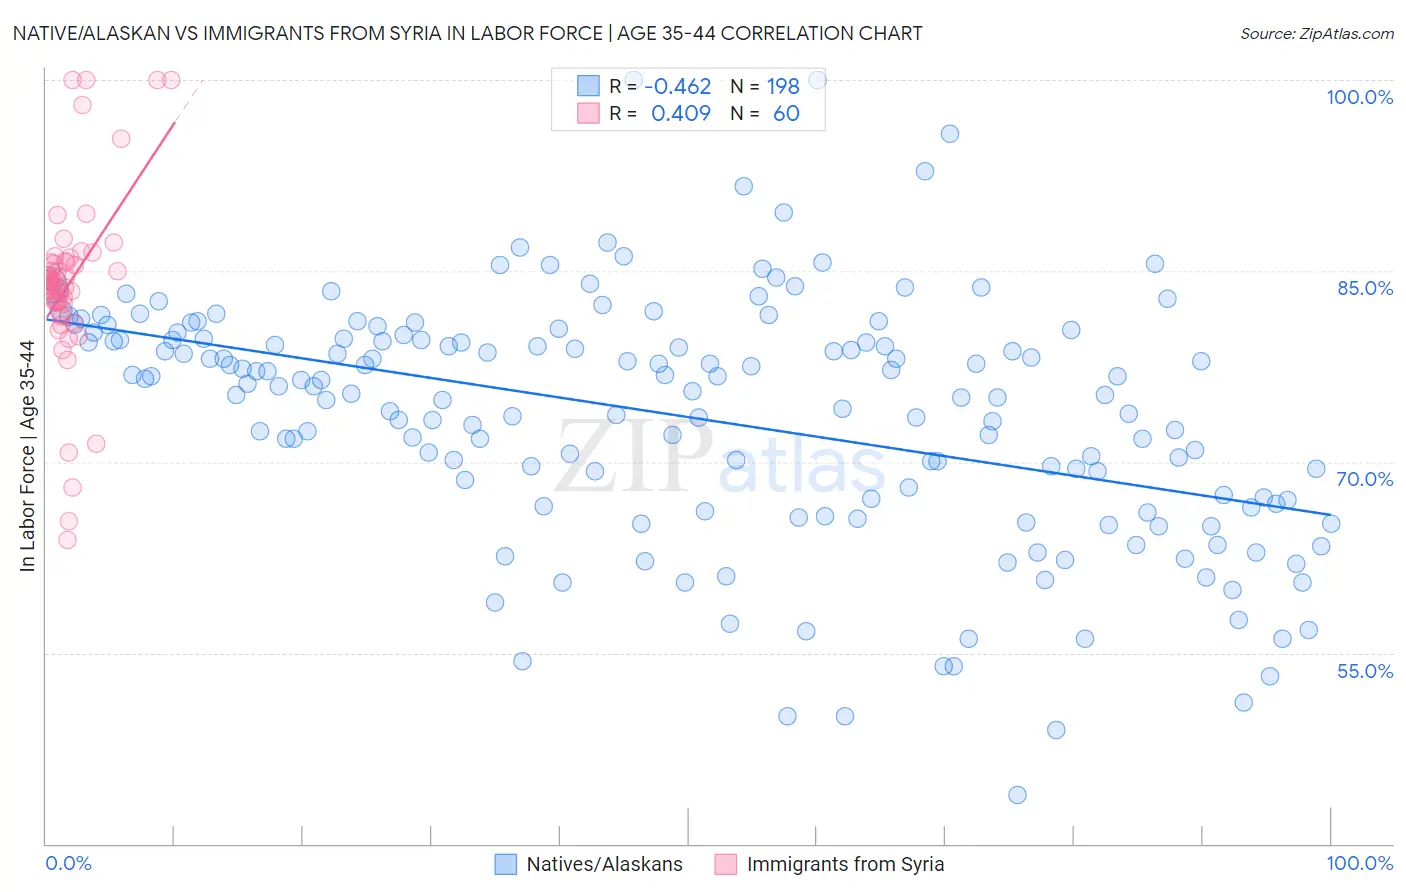
Native/Alaskan vs Immigrants from Syria In Labor Force | Age 35-44 Correlation Chart

The statistical analysis conducted on geographies consisting of 512,690,286 people shows a moderate negative correlation between the proportion of Natives/Alaskans and labor force participation rate among population between the ages 35 and 44 in the United States with a correlation coefficient (R) of -0.462 and weighted average of 78.9%. Similarly, the statistical analysis conducted on geographies consisting of 174,102,853 people shows a moderate positive correlation between the proportion of Immigrants from Syria and labor force participation rate among population between the ages 35 and 44 in the United States with a correlation coefficient (R) of 0.409 and weighted average of 83.9%, a difference of 6.3%.
Native/Alaskan vs Immigrants from Syria In Labor Force | Age 35-44

In Labor Force | Age 35-44 Correlation Summary

MeasurementNative/AlaskanImmigrants from Syria
Minimum43.8%63.8%
Maximum100.0%100.0%
Range56.2%36.2%
Mean73.5%84.0%
Median75.7%84.0%
Interquartile 25% (IQ1)67.0%82.4%
Interquartile 75% (IQ3)79.7%85.7%
Interquartile Range (IQR)12.7%3.3%
Standard Deviation (Sample)9.6%7.1%
Standard Deviation (Population)9.6%7.0%

Similar Demographics by In Labor Force | Age 35-44

Demographics Similar to Natives/Alaskans by In Labor Force | Age 35-44

In terms of in labor force | age 35-44, the demographic groups most similar to Natives/Alaskans are Yakama (79.0%, a difference of 0.11%), Kiowa (79.2%, a difference of 0.40%), Ute (79.4%, a difference of 0.73%), Houma (79.5%, a difference of 0.79%), and Cheyenne (79.5%, a difference of 0.81%).
DemographicsRating | RankIn Labor Force | Age 35-44
Creek
0.0
/100
|
#328
Tragic
80.0%
Menominee
0.0
/100
|
#329
Tragic
79.7%
Cheyenne
0.0
/100
|
#330
Tragic
79.5%
Houma
0.0
/100
|
#331
Tragic
79.5%
Ute
0.0
/100
|
#332
Tragic
79.4%
Kiowa
0.0
/100
|
#333
Tragic
79.2%
Yakama
0.0
/100
|
#334
Tragic
79.0%
Natives/Alaskans
0.0
/100
|
#335
Tragic
78.9%
Arapaho
0.0
/100
|
#336
Tragic
78.1%
Apache
0.0
/100
|
#337
Tragic
77.9%
Pueblo
0.0
/100
|
#338
Tragic
77.4%
Yup'ik
0.0
/100
|
#339
Tragic
77.3%
Lumbee
0.0
/100
|
#340
Tragic
77.0%
Hopi
0.0
/100
|
#341
Tragic
77.0%
Crow
0.0
/100
|
#342
Tragic
76.5%

Demographics Similar to Immigrants from Syria by In Labor Force | Age 35-44

In terms of in labor force | age 35-44, the demographic groups most similar to Immigrants from Syria are West Indian (83.9%, a difference of 0.0%), Immigrants from Oceania (83.9%, a difference of 0.010%), Immigrants from Germany (83.9%, a difference of 0.020%), Native Hawaiian (83.9%, a difference of 0.030%), and Scottish (83.9%, a difference of 0.040%).
DemographicsRating | RankIn Labor Force | Age 35-44
Welsh
5.3
/100
|
#228
Tragic
84.0%
Immigrants | Thailand
4.7
/100
|
#229
Tragic
84.0%
Immigrants | Iraq
3.7
/100
|
#230
Tragic
83.9%
Scottish
3.2
/100
|
#231
Tragic
83.9%
Native Hawaiians
3.0
/100
|
#232
Tragic
83.9%
Immigrants | Germany
2.8
/100
|
#233
Tragic
83.9%
Immigrants | Oceania
2.6
/100
|
#234
Tragic
83.9%
Immigrants | Syria
2.5
/100
|
#235
Tragic
83.9%
West Indians
2.4
/100
|
#236
Tragic
83.9%
English
1.8
/100
|
#237
Tragic
83.8%
Immigrants | Laos
1.7
/100
|
#238
Tragic
83.8%
Celtics
1.4
/100
|
#239
Tragic
83.8%
Arabs
1.3
/100
|
#240
Tragic
83.8%
Iraqis
1.3
/100
|
#241
Tragic
83.8%
Immigrants | Cambodia
1.1
/100
|
#242
Tragic
83.8%