Native Hawaiian vs Immigrants from Portugal In Labor Force | Age > 16
COMPARE
Native Hawaiian
Immigrants from Portugal
In Labor Force | Age > 16
In Labor Force | Age > 16 Comparison
Native Hawaiians
Immigrants from Portugal
64.1%
IN LABOR FORCE | AGE > 16
0.3/ 100
METRIC RATING
272nd/ 347
METRIC RANK
65.0%
IN LABOR FORCE | AGE > 16
34.8/ 100
METRIC RATING
188th/ 347
METRIC RANK
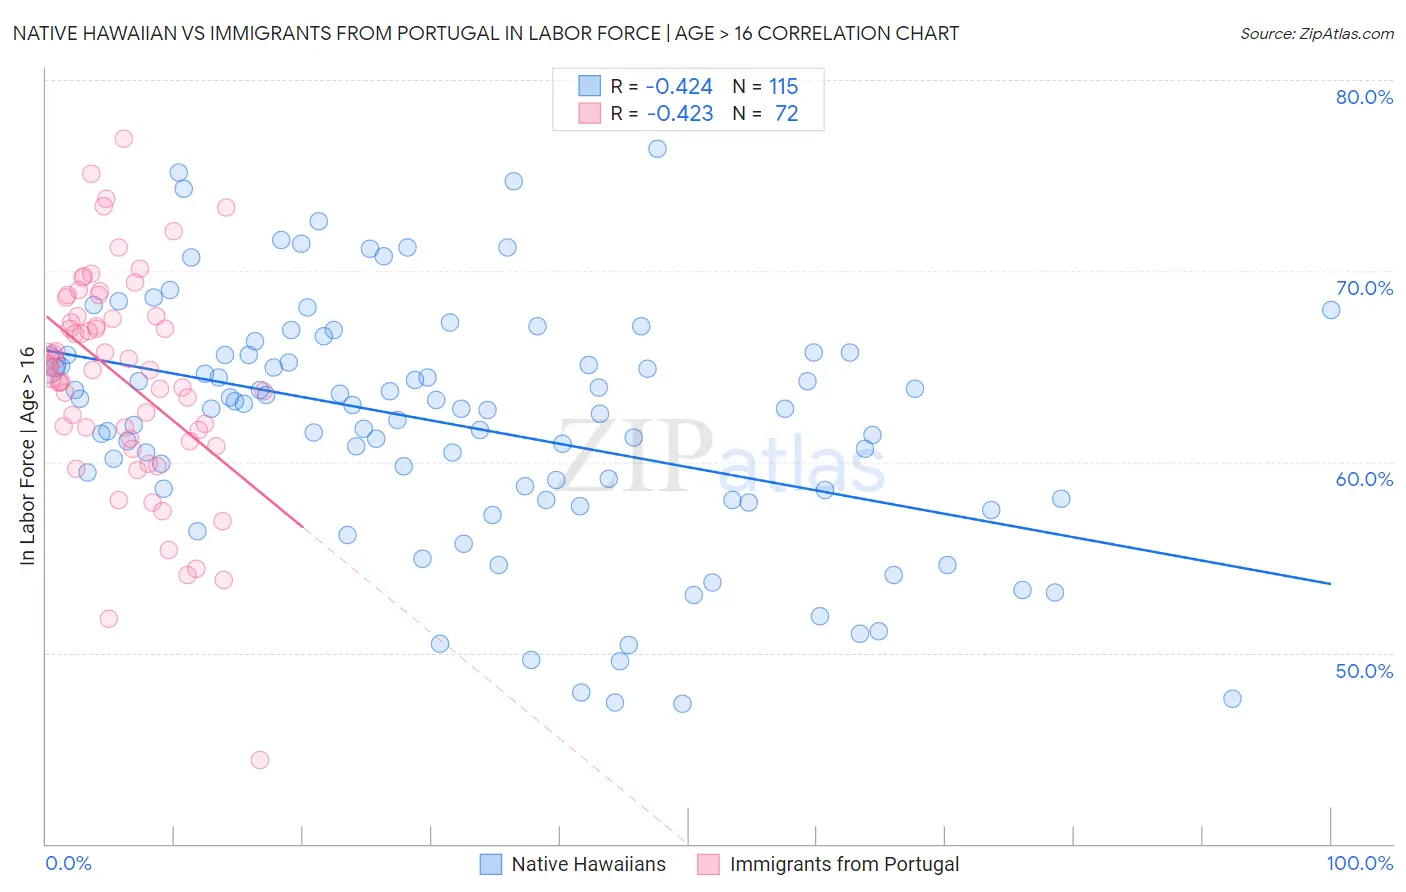
Native Hawaiian vs Immigrants from Portugal In Labor Force | Age > 16 Correlation Chart
The statistical analysis conducted on geographies consisting of 332,118,603 people shows a moderate negative correlation between the proportion of Native Hawaiians and labor force participation rate among population ages 16 and over in the United States with a correlation coefficient (R) of -0.424 and weighted average of 64.1%. Similarly, the statistical analysis conducted on geographies consisting of 174,779,205 people shows a moderate negative correlation between the proportion of Immigrants from Portugal and labor force participation rate among population ages 16 and over in the United States with a correlation coefficient (R) of -0.423 and weighted average of 65.0%, a difference of 1.4%.
In Labor Force | Age > 16 Correlation Summary
| Measurement | Native Hawaiian | Immigrants from Portugal |
| Minimum | 47.3% | 44.4% |
| Maximum | 76.4% | 76.9% |
| Range | 29.1% | 32.5% |
| Mean | 61.9% | 64.4% |
| Median | 62.8% | 64.9% |
| Interquartile 25% (IQ1) | 58.1% | 61.5% |
| Interquartile 75% (IQ3) | 65.6% | 67.6% |
| Interquartile Range (IQR) | 7.5% | 6.2% |
| Standard Deviation (Sample) | 6.3% | 5.7% |
| Standard Deviation (Population) | 6.3% | 5.6% |
Similar Demographics by In Labor Force | Age > 16
Demographics Similar to Native Hawaiians by In Labor Force | Age > 16
In terms of in labor force | age > 16, the demographic groups most similar to Native Hawaiians are Hmong (64.1%, a difference of 0.0%), Immigrants from Cuba (64.1%, a difference of 0.020%), Mexican (64.1%, a difference of 0.020%), French American Indian (64.1%, a difference of 0.020%), and Guyanese (64.1%, a difference of 0.030%).
| Demographics | Rating | Rank | In Labor Force | Age > 16 |
| Cubans | 0.5 /100 | #265 | Tragic 64.2% |
| Immigrants | England | 0.5 /100 | #266 | Tragic 64.2% |
| Canadians | 0.5 /100 | #267 | Tragic 64.1% |
| Spaniards | 0.5 /100 | #268 | Tragic 64.1% |
| Irish | 0.4 /100 | #269 | Tragic 64.1% |
| Guyanese | 0.4 /100 | #270 | Tragic 64.1% |
| Dominicans | 0.4 /100 | #271 | Tragic 64.1% |
| Native Hawaiians | 0.3 /100 | #272 | Tragic 64.1% |
| Hmong | 0.3 /100 | #273 | Tragic 64.1% |
| Immigrants | Cuba | 0.3 /100 | #274 | Tragic 64.1% |
| Mexicans | 0.3 /100 | #275 | Tragic 64.1% |
| French American Indians | 0.3 /100 | #276 | Tragic 64.1% |
| Immigrants | Bahamas | 0.3 /100 | #277 | Tragic 64.0% |
| Assyrians/Chaldeans/Syriacs | 0.3 /100 | #278 | Tragic 64.0% |
| Welsh | 0.2 /100 | #279 | Tragic 64.0% |
Demographics Similar to Immigrants from Portugal by In Labor Force | Age > 16
In terms of in labor force | age > 16, the demographic groups most similar to Immigrants from Portugal are Immigrants from Croatia (65.0%, a difference of 0.010%), Immigrants from Greece (65.0%, a difference of 0.010%), Barbadian (65.0%, a difference of 0.010%), Scandinavian (65.0%, a difference of 0.010%), and Immigrants from Fiji (65.0%, a difference of 0.010%).
| Demographics | Rating | Rank | In Labor Force | Age > 16 |
| Immigrants | Panama | 42.4 /100 | #181 | Average 65.1% |
| Immigrants | Nicaragua | 41.1 /100 | #182 | Average 65.1% |
| Soviet Union | 40.5 /100 | #183 | Average 65.0% |
| Carpatho Rusyns | 40.0 /100 | #184 | Average 65.0% |
| Syrians | 40.0 /100 | #185 | Average 65.0% |
| Immigrants | Switzerland | 38.2 /100 | #186 | Fair 65.0% |
| Immigrants | Croatia | 35.7 /100 | #187 | Fair 65.0% |
| Immigrants | Portugal | 34.8 /100 | #188 | Fair 65.0% |
| Immigrants | Greece | 34.3 /100 | #189 | Fair 65.0% |
| Barbadians | 33.9 /100 | #190 | Fair 65.0% |
| Scandinavians | 33.7 /100 | #191 | Fair 65.0% |
| Immigrants | Fiji | 33.7 /100 | #192 | Fair 65.0% |
| Immigrants | Europe | 33.6 /100 | #193 | Fair 65.0% |
| Immigrants | Southern Europe | 31.3 /100 | #194 | Fair 65.0% |
| Romanians | 31.1 /100 | #195 | Fair 65.0% |