Menominee vs South American Indian In Labor Force | Age 20-24
COMPARE
Menominee
South American Indian
In Labor Force | Age 20-24
In Labor Force | Age 20-24 Comparison
Menominee
South American Indians
68.7%
IN LABOR FORCE | AGE 20-24
0.0/ 100
METRIC RATING
340th/ 347
METRIC RANK
75.3%
IN LABOR FORCE | AGE 20-24
69.0/ 100
METRIC RATING
159th/ 347
METRIC RANK
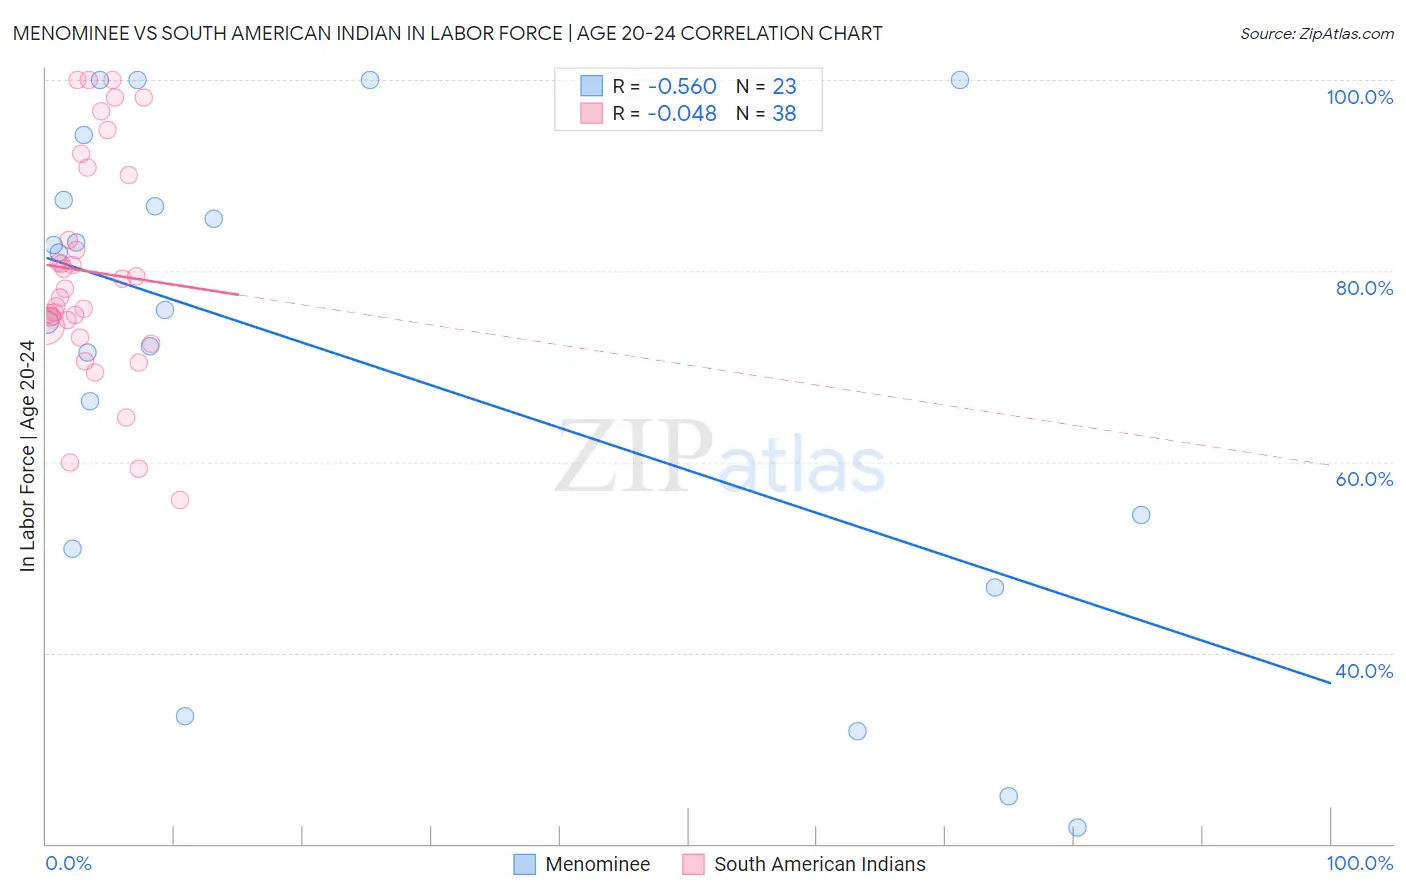
Menominee vs South American Indian In Labor Force | Age 20-24 Correlation Chart
The statistical analysis conducted on geographies consisting of 45,776,485 people shows a substantial negative correlation between the proportion of Menominee and labor force participation rate among population between the ages 20 and 24 in the United States with a correlation coefficient (R) of -0.560 and weighted average of 68.7%. Similarly, the statistical analysis conducted on geographies consisting of 164,558,708 people shows no correlation between the proportion of South American Indians and labor force participation rate among population between the ages 20 and 24 in the United States with a correlation coefficient (R) of -0.048 and weighted average of 75.3%, a difference of 9.6%.
In Labor Force | Age 20-24 Correlation Summary
| Measurement | Menominee | South American Indian |
| Minimum | 21.7% | 56.0% |
| Maximum | 100.0% | 100.0% |
| Range | 78.3% | 44.0% |
| Mean | 70.7% | 79.9% |
| Median | 75.9% | 77.7% |
| Interquartile 25% (IQ1) | 50.9% | 74.3% |
| Interquartile 75% (IQ3) | 87.4% | 90.0% |
| Interquartile Range (IQR) | 36.5% | 15.7% |
| Standard Deviation (Sample) | 25.1% | 11.6% |
| Standard Deviation (Population) | 24.5% | 11.5% |
Similar Demographics by In Labor Force | Age 20-24
Demographics Similar to Menominee by In Labor Force | Age 20-24
In terms of in labor force | age 20-24, the demographic groups most similar to Menominee are Tohono O'odham (68.6%, a difference of 0.13%), Immigrants from Yemen (68.9%, a difference of 0.31%), Pima (69.0%, a difference of 0.44%), Immigrants from St. Vincent and the Grenadines (68.4%, a difference of 0.44%), and Puerto Rican (68.3%, a difference of 0.56%).
| Demographics | Rating | Rank | In Labor Force | Age 20-24 |
| Yuman | 0.0 /100 | #333 | Tragic 70.3% |
| British West Indians | 0.0 /100 | #334 | Tragic 70.0% |
| Immigrants | Barbados | 0.0 /100 | #335 | Tragic 69.7% |
| Immigrants | Guyana | 0.0 /100 | #336 | Tragic 69.3% |
| Guyanese | 0.0 /100 | #337 | Tragic 69.2% |
| Pima | 0.0 /100 | #338 | Tragic 69.0% |
| Immigrants | Yemen | 0.0 /100 | #339 | Tragic 68.9% |
| Menominee | 0.0 /100 | #340 | Tragic 68.7% |
| Tohono O'odham | 0.0 /100 | #341 | Tragic 68.6% |
| Immigrants | St. Vincent and the Grenadines | 0.0 /100 | #342 | Tragic 68.4% |
| Puerto Ricans | 0.0 /100 | #343 | Tragic 68.3% |
| Immigrants | Grenada | 0.0 /100 | #344 | Tragic 67.2% |
| Hopi | 0.0 /100 | #345 | Tragic 66.0% |
| Lumbee | 0.0 /100 | #346 | Tragic 65.5% |
| Navajo | 0.0 /100 | #347 | Tragic 64.8% |
Demographics Similar to South American Indians by In Labor Force | Age 20-24
In terms of in labor force | age 20-24, the demographic groups most similar to South American Indians are Japanese (75.3%, a difference of 0.010%), Immigrants from Bolivia (75.3%, a difference of 0.030%), Immigrants from Western Europe (75.3%, a difference of 0.040%), Immigrants from Guatemala (75.3%, a difference of 0.050%), and Immigrants from El Salvador (75.3%, a difference of 0.050%).
| Demographics | Rating | Rank | In Labor Force | Age 20-24 |
| Lebanese | 73.5 /100 | #152 | Good 75.3% |
| Guatemalans | 72.3 /100 | #153 | Good 75.3% |
| Osage | 72.3 /100 | #154 | Good 75.3% |
| Immigrants | Guatemala | 71.9 /100 | #155 | Good 75.3% |
| Immigrants | El Salvador | 71.7 /100 | #156 | Good 75.3% |
| Immigrants | Western Europe | 71.5 /100 | #157 | Good 75.3% |
| Immigrants | Bolivia | 71.0 /100 | #158 | Good 75.3% |
| South American Indians | 69.0 /100 | #159 | Good 75.3% |
| Japanese | 68.7 /100 | #160 | Good 75.3% |
| New Zealanders | 65.4 /100 | #161 | Good 75.2% |
| Immigrants | Romania | 64.6 /100 | #162 | Good 75.2% |
| Costa Ricans | 64.2 /100 | #163 | Good 75.2% |
| Bolivians | 64.0 /100 | #164 | Good 75.2% |
| Afghans | 63.5 /100 | #165 | Good 75.2% |
| Cambodians | 60.5 /100 | #166 | Good 75.2% |