Maltese vs Immigrants from Middle Africa In Labor Force | Age 25-29

COMPARE

Maltese
Race
Ancestry
AfghanAfricanAlaska NativeAlaskan AthabascanAlbanianAleutAlsatianAmericanApacheArabArapahoArgentineanArmenianAssyrian/Chaldean/SyriacAustralianAustrianBahamianBangladeshiBarbadianBasqueBelgianBelizeanBermudanBhutaneseBlackfeetBolivianBrazilianBritishBritish West IndianBulgarianBurmeseCajunCambodianCanadianCape VerdeanCarpatho RusynCelticCentral AmericanCentral American IndianCherokeeCheyenneChickasawChileanChineseChippewaChoctawColombianColvilleComancheCosta RicanCreeCreekCroatianCrowCubanCypriotCzechCzechoslovakianDanishDelawareDominicanDutchDutch West IndianEastern EuropeanEcuadorianEgyptianEnglishEstonianEthiopianEuropeanFijianFilipinoFinnishFrenchFrench American IndianFrench CanadianGermanGerman RussianGhanaianGreekGuamanian/ChamorroGuatemalanGuyaneseHaitianHmongHonduranHopiHoumaHungarianIcelanderIndian (Asian)IndonesianInupiatIranianIraqiIrishIroquoisIsraeliItalianJamaicanJapaneseJordanianKenyanKiowaKoreanLaotianLatvianLebaneseLiberianLithuanianLumbeeLuxembourgerMacedonianMalaysianMalteseMarshalleseMenomineeMexicanMexican American IndianMongolianMoroccanNative HawaiianNavajoNepaleseNew ZealanderNicaraguanNigerianNorthern EuropeanNorwegianOkinawanOsageOttawaPaiutePakistaniPalestinianPanamanianParaguayanPennsylvania GermanPeruvianPimaPolishPortuguesePotawatomiPuebloPuerto RicanPuget Sound SalishRomanianRussianSalvadoranSamoanScandinavianScotch-IrishScottishSeminoleSenegaleseSerbianShoshoneSierra LeoneanSiouxSlavicSlovakSloveneSomaliSouth AfricanSouth AmericanSouth American IndianSoviet UnionSpaniardSpanishSpanish AmericanSpanish American IndianSri LankanSubsaharan AfricanSudaneseSwedishSwissSyrianTaiwaneseThaiTlingit-HaidaTohono O'OdhamTonganTrinidadian and TobagonianTsimshianTurkishU.S. Virgin IslanderUgandanUkrainianUruguayanUteVenezuelanVietnameseWelshWest IndianYakamaYaquiYugoslavianYumanYup'ikZimbabwean
Immigration
NonimmigrantsImmigrantsAfghanistanAfricaAlbaniaArgentinaArmeniaAsiaAustraliaAustriaBahamasBangladeshBarbadosBelarusBelgiumBelizeBoliviaBosnia and HerzegovinaBrazilBulgariaBurma/MyanmarCabo VerdeCambodiaCameroonCanadaCaribbeanCentral AmericaChileChinaColombiaCongoCosta RicaCroatiaCubaCzechoslovakiaDenmarkDominicaDominican RepublicEastern AfricaEastern AsiaEastern EuropeEcuadorEgyptEl SalvadorEnglandEritreaEthiopiaEuropeFijiFranceGermanyGhanaGreeceGrenadaGuatemalaGuyanaHaitiHondurasHong KongHungaryIndiaIndonesiaIranIraqIrelandIsraelItalyJamaicaJapanJordanKazakhstanKenyaKoreaKuwaitLaosLatin AmericaLatviaLebanonLiberiaLithuaniaMalaysiaMexicoMicronesiaMoldovaMoroccoNepalNetherlandsNicaraguaNigeriaNorth AmericaNorth MacedoniaNorthern AfricaNorthern EuropeNorwayOceaniaPakistanPanamaPeruPhilippinesPolandPortugalRomaniaRussiaSaudi ArabiaScotlandSenegalSerbiaSierra LeoneSingaporeSomaliaSouth AfricaSouth AmericaSouth Central AsiaSouth Eastern AsiaSouthern EuropeSpainSri LankaSt. Vincent and the GrenadinesSudanSwedenSwitzerlandSyriaTaiwanThailandTrinidad and TobagoTurkeyUgandaUkraineUruguayUzbekistanVenezuelaVietnamWest IndiesWestern AfricaWestern AsiaWestern EuropeYemenZaireZimbabweAzores
Immigrants from Middle Africa
Race
Ancestry
AfghanAfricanAlaska NativeAlaskan AthabascanAlbanianAleutAlsatianAmericanApacheArabArapahoArgentineanArmenianAssyrian/Chaldean/SyriacAustralianAustrianBahamianBangladeshiBarbadianBasqueBelgianBelizeanBermudanBhutaneseBlackfeetBolivianBrazilianBritishBritish West IndianBulgarianBurmeseCajunCambodianCanadianCape VerdeanCarpatho RusynCelticCentral AmericanCentral American IndianCherokeeCheyenneChickasawChileanChineseChippewaChoctawColombianColvilleComancheCosta RicanCreeCreekCroatianCrowCubanCypriotCzechCzechoslovakianDanishDelawareDominicanDutchDutch West IndianEastern EuropeanEcuadorianEgyptianEnglishEstonianEthiopianEuropeanFijianFilipinoFinnishFrenchFrench American IndianFrench CanadianGermanGerman RussianGhanaianGreekGuamanian/ChamorroGuatemalanGuyaneseHaitianHmongHonduranHopiHoumaHungarianIcelanderIndian (Asian)IndonesianInupiatIranianIraqiIrishIroquoisIsraeliItalianJamaicanJapaneseJordanianKenyanKiowaKoreanLaotianLatvianLebaneseLiberianLithuanianLumbeeLuxembourgerMacedonianMalaysianMarshalleseMenomineeMexicanMexican American IndianMongolianMoroccanNative HawaiianNavajoNepaleseNew ZealanderNicaraguanNigerianNorthern EuropeanNorwegianOkinawanOsageOttawaPaiutePakistaniPalestinianPanamanianParaguayanPennsylvania GermanPeruvianPimaPolishPortuguesePotawatomiPuebloPuerto RicanPuget Sound SalishRomanianRussianSalvadoranSamoanScandinavianScotch-IrishScottishSeminoleSenegaleseSerbianShoshoneSierra LeoneanSiouxSlavicSlovakSloveneSomaliSouth AfricanSouth AmericanSouth American IndianSoviet UnionSpaniardSpanishSpanish AmericanSpanish American IndianSri LankanSubsaharan AfricanSudaneseSwedishSwissSyrianTaiwaneseThaiTlingit-HaidaTohono O'OdhamTonganTrinidadian and TobagonianTsimshianTurkishU.S. Virgin IslanderUgandanUkrainianUruguayanUteVenezuelanVietnameseWelshWest IndianYakamaYaquiYugoslavianYumanYup'ikZimbabwean
Immigration
NonimmigrantsImmigrantsAfghanistanAfricaAlbaniaArgentinaArmeniaAsiaAustraliaAustriaBahamasBangladeshBarbadosBelarusBelgiumBelizeBoliviaBosnia and HerzegovinaBrazilBulgariaBurma/MyanmarCabo VerdeCambodiaCameroonCanadaCaribbeanCentral AmericaChileChinaColombiaCongoCosta RicaCroatiaCubaCzechoslovakiaDenmarkDominicaDominican RepublicEastern AfricaEastern AsiaEastern EuropeEcuadorEgyptEl SalvadorEnglandEritreaEthiopiaEuropeFijiFranceGermanyGhanaGreeceGrenadaGuatemalaGuyanaHaitiHondurasHong KongHungaryIndiaIndonesiaIranIraqIrelandIsraelItalyJamaicaJapanJordanKazakhstanKenyaKoreaKuwaitLaosLatin AmericaLatviaLebanonLiberiaLithuaniaMalaysiaMexicoMicronesiaMiddle AfricaMoldovaMoroccoNepalNetherlandsNicaraguaNigeriaNorth AmericaNorth MacedoniaNorthern AfricaNorthern EuropeNorwayOceaniaPakistanPanamaPeruPhilippinesPolandPortugalRomaniaRussiaSaudi ArabiaScotlandSenegalSerbiaSierra LeoneSingaporeSomaliaSouth AfricaSouth AmericaSouth Central AsiaSouth Eastern AsiaSouthern EuropeSpainSri LankaSt. Vincent and the GrenadinesSudanSwedenSwitzerlandSyriaTaiwanThailandTrinidad and TobagoTurkeyUgandaUkraineUruguayUzbekistanVenezuelaVietnamWest IndiesWestern AfricaWestern AsiaWestern EuropeYemenZaireZimbabweAzores
In Labor Force | Age 25-29
Income
Poverty
Unemployment
Labor Participation
Family Structure
Vehicle Availability
Education Level
Disability

In Labor Force | Age 25-29 Comparison

Maltese

Immigrants from Middle Africa

Exceptional
Exceptional
86.0%
IN LABOR FORCE | AGE 25-29
100.0/ 100
METRIC RATING
21st/ 347
METRIC RANK
85.0%
IN LABOR FORCE | AGE 25-29
91.4/ 100
METRIC RATING
111th/ 347
METRIC RANK

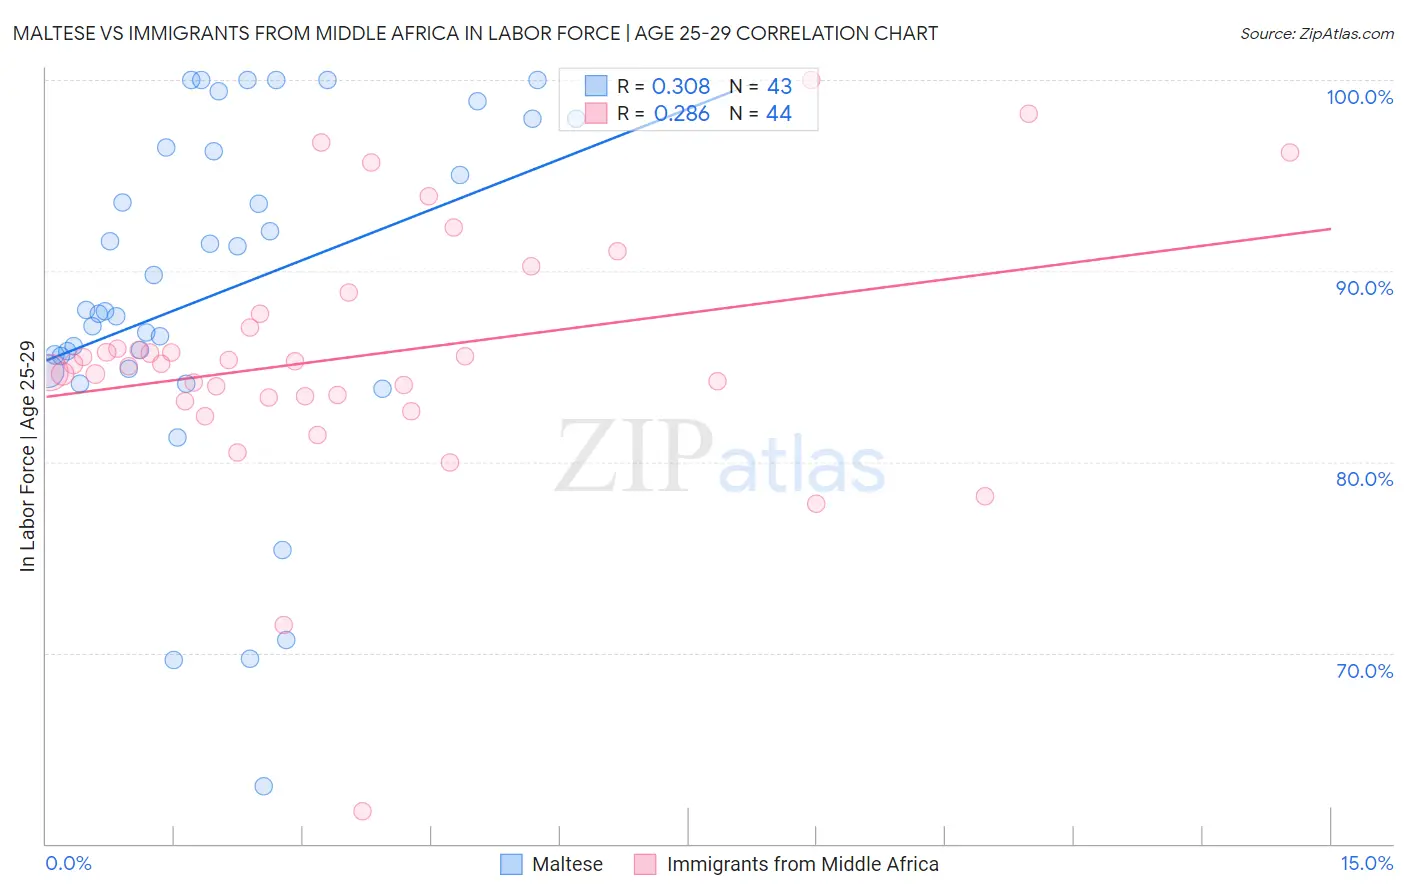
Maltese vs Immigrants from Middle Africa In Labor Force | Age 25-29 Correlation Chart

The statistical analysis conducted on geographies consisting of 126,432,251 people shows a mild positive correlation between the proportion of Maltese and labor force participation rate among population between the ages 25 and 29 in the United States with a correlation coefficient (R) of 0.308 and weighted average of 86.0%. Similarly, the statistical analysis conducted on geographies consisting of 202,727,478 people shows a weak positive correlation between the proportion of Immigrants from Middle Africa and labor force participation rate among population between the ages 25 and 29 in the United States with a correlation coefficient (R) of 0.286 and weighted average of 85.0%, a difference of 1.1%.
Maltese vs Immigrants from Middle Africa In Labor Force | Age 25-29

In Labor Force | Age 25-29 Correlation Summary

MeasurementMalteseImmigrants from Middle Africa
Minimum63.0%61.7%
Maximum100.0%100.0%
Range37.0%38.3%
Mean88.8%85.5%
Median87.9%85.1%
Interquartile 25% (IQ1)84.9%83.4%
Interquartile 75% (IQ3)96.5%87.4%
Interquartile Range (IQR)11.6%4.0%
Standard Deviation (Sample)9.1%6.6%
Standard Deviation (Population)9.0%6.6%

Similar Demographics by In Labor Force | Age 25-29

Demographics Similar to Maltese by In Labor Force | Age 25-29

In terms of in labor force | age 25-29, the demographic groups most similar to Maltese are Immigrants from Ireland (86.0%, a difference of 0.010%), Cambodian (86.0%, a difference of 0.010%), Cape Verdean (86.0%, a difference of 0.020%), Bulgarian (86.0%, a difference of 0.030%), and Immigrants from Uganda (86.0%, a difference of 0.030%).
DemographicsRating | RankIn Labor Force | Age 25-29
Latvians
100.0
/100
|
#14
Exceptional
86.1%
Bolivians
100.0
/100
|
#15
Exceptional
86.1%
Immigrants | Bolivia
100.0
/100
|
#16
Exceptional
86.1%
Bermudans
100.0
/100
|
#17
Exceptional
86.0%
Bulgarians
100.0
/100
|
#18
Exceptional
86.0%
Cape Verdeans
100.0
/100
|
#19
Exceptional
86.0%
Immigrants | Ireland
100.0
/100
|
#20
Exceptional
86.0%
Maltese
100.0
/100
|
#21
Exceptional
86.0%
Cambodians
100.0
/100
|
#22
Exceptional
86.0%
Immigrants | Uganda
100.0
/100
|
#23
Exceptional
86.0%
Immigrants | Eastern Africa
100.0
/100
|
#24
Exceptional
86.0%
Sudanese
100.0
/100
|
#25
Exceptional
85.9%
Immigrants | North Macedonia
100.0
/100
|
#26
Exceptional
85.9%
Paraguayans
100.0
/100
|
#27
Exceptional
85.9%
Ugandans
100.0
/100
|
#28
Exceptional
85.9%

Demographics Similar to Immigrants from Middle Africa by In Labor Force | Age 25-29

In terms of in labor force | age 25-29, the demographic groups most similar to Immigrants from Middle Africa are New Zealander (85.0%, a difference of 0.0%), Immigrants from Austria (85.0%, a difference of 0.010%), Costa Rican (85.0%, a difference of 0.010%), Senegalese (85.0%, a difference of 0.010%), and Immigrants from Southern Europe (85.0%, a difference of 0.020%).
DemographicsRating | RankIn Labor Force | Age 25-29
Immigrants | Zaire
93.3
/100
|
#104
Exceptional
85.1%
Immigrants | Hong Kong
92.8
/100
|
#105
Exceptional
85.0%
Czechoslovakians
92.6
/100
|
#106
Exceptional
85.0%
Immigrants | Southern Europe
92.3
/100
|
#107
Exceptional
85.0%
Immigrants | Austria
91.9
/100
|
#108
Exceptional
85.0%
Costa Ricans
91.9
/100
|
#109
Exceptional
85.0%
New Zealanders
91.5
/100
|
#110
Exceptional
85.0%
Immigrants | Middle Africa
91.4
/100
|
#111
Exceptional
85.0%
Senegalese
90.9
/100
|
#112
Exceptional
85.0%
Irish
90.6
/100
|
#113
Exceptional
85.0%
Immigrants | Malaysia
90.4
/100
|
#114
Exceptional
85.0%
South Africans
88.9
/100
|
#115
Excellent
85.0%
Chileans
88.8
/100
|
#116
Excellent
85.0%
Immigrants | Belarus
88.0
/100
|
#117
Excellent
85.0%
Finns
87.8
/100
|
#118
Excellent
85.0%