Maltese vs Arab In Labor Force | Age 45-54

COMPARE

Maltese
Race
Ancestry
AfghanAfricanAlaska NativeAlaskan AthabascanAlbanianAleutAlsatianAmericanApacheArapahoArgentineanArmenianAssyrian/Chaldean/SyriacAustralianAustrianBahamianBangladeshiBarbadianBasqueBelgianBelizeanBermudanBhutaneseBlackfeetBolivianBrazilianBritishBritish West IndianBulgarianBurmeseCajunCambodianCanadianCape VerdeanCarpatho RusynCelticCentral AmericanCentral American IndianCherokeeCheyenneChickasawChileanChineseChippewaChoctawColombianColvilleComancheCosta RicanCreeCreekCroatianCrowCubanCypriotCzechCzechoslovakianDanishDelawareDominicanDutchDutch West IndianEastern EuropeanEcuadorianEgyptianEnglishEstonianEthiopianEuropeanFijianFilipinoFinnishFrenchFrench American IndianFrench CanadianGermanGerman RussianGhanaianGreekGuamanian/ChamorroGuatemalanGuyaneseHaitianHmongHonduranHopiHoumaHungarianIcelanderIndian (Asian)IndonesianInupiatIranianIraqiIrishIroquoisIsraeliItalianJamaicanJapaneseJordanianKenyanKiowaKoreanLaotianLatvianLebaneseLiberianLithuanianLumbeeLuxembourgerMacedonianMalaysianMalteseMarshalleseMenomineeMexicanMexican American IndianMongolianMoroccanNative HawaiianNavajoNepaleseNew ZealanderNicaraguanNigerianNorthern EuropeanNorwegianOkinawanOsageOttawaPaiutePakistaniPalestinianPanamanianParaguayanPennsylvania GermanPeruvianPimaPolishPortuguesePotawatomiPuebloPuerto RicanPuget Sound SalishRomanianRussianSalvadoranSamoanScandinavianScotch-IrishScottishSeminoleSenegaleseSerbianShoshoneSierra LeoneanSiouxSlavicSlovakSloveneSomaliSouth AfricanSouth AmericanSouth American IndianSoviet UnionSpaniardSpanishSpanish AmericanSpanish American IndianSri LankanSubsaharan AfricanSudaneseSwedishSwissSyrianTaiwaneseThaiTlingit-HaidaTohono O'OdhamTonganTrinidadian and TobagonianTsimshianTurkishU.S. Virgin IslanderUgandanUkrainianUruguayanUteVenezuelanVietnameseWelshWest IndianYakamaYaquiYugoslavianYumanYup'ikZimbabwean
Immigration
NonimmigrantsImmigrantsAfghanistanAfricaAlbaniaArgentinaArmeniaAsiaAustraliaAustriaBahamasBangladeshBarbadosBelarusBelgiumBelizeBoliviaBosnia and HerzegovinaBrazilBulgariaBurma/MyanmarCabo VerdeCambodiaCameroonCanadaCaribbeanCentral AmericaChileChinaColombiaCongoCosta RicaCroatiaCubaCzechoslovakiaDenmarkDominicaDominican RepublicEastern AfricaEastern AsiaEastern EuropeEcuadorEgyptEl SalvadorEnglandEritreaEthiopiaEuropeFijiFranceGermanyGhanaGreeceGrenadaGuatemalaGuyanaHaitiHondurasHong KongHungaryIndiaIndonesiaIranIraqIrelandIsraelItalyJamaicaJapanJordanKazakhstanKenyaKoreaKuwaitLaosLatin AmericaLatviaLebanonLiberiaLithuaniaMalaysiaMexicoMicronesiaMiddle AfricaMoldovaMoroccoNepalNetherlandsNicaraguaNigeriaNorth AmericaNorth MacedoniaNorthern AfricaNorthern EuropeNorwayOceaniaPakistanPanamaPeruPhilippinesPolandPortugalRomaniaRussiaSaudi ArabiaScotlandSenegalSerbiaSierra LeoneSingaporeSomaliaSouth AfricaSouth AmericaSouth Central AsiaSouth Eastern AsiaSouthern EuropeSpainSri LankaSt. Vincent and the GrenadinesSudanSwedenSwitzerlandSyriaTaiwanThailandTrinidad and TobagoTurkeyUgandaUkraineUruguayUzbekistanVenezuelaVietnamWest IndiesWestern AfricaWestern AsiaWestern EuropeYemenZaireZimbabweAzores
Arab
Race
Ancestry
AfghanAfricanAlaska NativeAlaskan AthabascanAlbanianAleutAlsatianAmericanApacheArabArapahoArgentineanArmenianAssyrian/Chaldean/SyriacAustralianAustrianBahamianBangladeshiBarbadianBasqueBelgianBelizeanBermudanBhutaneseBlackfeetBolivianBrazilianBritishBritish West IndianBulgarianBurmeseCajunCambodianCanadianCape VerdeanCarpatho RusynCelticCentral AmericanCentral American IndianCherokeeCheyenneChickasawChileanChineseChippewaChoctawColombianColvilleComancheCosta RicanCreeCreekCroatianCrowCubanCypriotCzechCzechoslovakianDanishDelawareDominicanDutchDutch West IndianEastern EuropeanEcuadorianEgyptianEnglishEstonianEthiopianEuropeanFijianFilipinoFinnishFrenchFrench American IndianFrench CanadianGermanGerman RussianGhanaianGreekGuamanian/ChamorroGuatemalanGuyaneseHaitianHmongHonduranHopiHoumaHungarianIcelanderIndian (Asian)IndonesianInupiatIranianIraqiIrishIroquoisIsraeliItalianJamaicanJapaneseJordanianKenyanKiowaKoreanLaotianLatvianLebaneseLiberianLithuanianLumbeeLuxembourgerMacedonianMalaysianMarshalleseMenomineeMexicanMexican American IndianMongolianMoroccanNative HawaiianNavajoNepaleseNew ZealanderNicaraguanNigerianNorthern EuropeanNorwegianOkinawanOsageOttawaPaiutePakistaniPalestinianPanamanianParaguayanPennsylvania GermanPeruvianPimaPolishPortuguesePotawatomiPuebloPuerto RicanPuget Sound SalishRomanianRussianSalvadoranSamoanScandinavianScotch-IrishScottishSeminoleSenegaleseSerbianShoshoneSierra LeoneanSiouxSlavicSlovakSloveneSomaliSouth AfricanSouth AmericanSouth American IndianSoviet UnionSpaniardSpanishSpanish AmericanSpanish American IndianSri LankanSubsaharan AfricanSudaneseSwedishSwissSyrianTaiwaneseThaiTlingit-HaidaTohono O'OdhamTonganTrinidadian and TobagonianTsimshianTurkishU.S. Virgin IslanderUgandanUkrainianUruguayanUteVenezuelanVietnameseWelshWest IndianYakamaYaquiYugoslavianYumanYup'ikZimbabwean
Immigration
NonimmigrantsImmigrantsAfghanistanAfricaAlbaniaArgentinaArmeniaAsiaAustraliaAustriaBahamasBangladeshBarbadosBelarusBelgiumBelizeBoliviaBosnia and HerzegovinaBrazilBulgariaBurma/MyanmarCabo VerdeCambodiaCameroonCanadaCaribbeanCentral AmericaChileChinaColombiaCongoCosta RicaCroatiaCubaCzechoslovakiaDenmarkDominicaDominican RepublicEastern AfricaEastern AsiaEastern EuropeEcuadorEgyptEl SalvadorEnglandEritreaEthiopiaEuropeFijiFranceGermanyGhanaGreeceGrenadaGuatemalaGuyanaHaitiHondurasHong KongHungaryIndiaIndonesiaIranIraqIrelandIsraelItalyJamaicaJapanJordanKazakhstanKenyaKoreaKuwaitLaosLatin AmericaLatviaLebanonLiberiaLithuaniaMalaysiaMexicoMicronesiaMiddle AfricaMoldovaMoroccoNepalNetherlandsNicaraguaNigeriaNorth AmericaNorth MacedoniaNorthern AfricaNorthern EuropeNorwayOceaniaPakistanPanamaPeruPhilippinesPolandPortugalRomaniaRussiaSaudi ArabiaScotlandSenegalSerbiaSierra LeoneSingaporeSomaliaSouth AfricaSouth AmericaSouth Central AsiaSouth Eastern AsiaSouthern EuropeSpainSri LankaSt. Vincent and the GrenadinesSudanSwedenSwitzerlandSyriaTaiwanThailandTrinidad and TobagoTurkeyUgandaUkraineUruguayUzbekistanVenezuelaVietnamWest IndiesWestern AfricaWestern AsiaWestern EuropeYemenZaireZimbabweAzores
In Labor Force | Age 45-54
Income
Poverty
Unemployment
Labor Participation
Family Structure
Vehicle Availability
Education Level
Disability

In Labor Force | Age 45-54 Comparison

Maltese

Arabs

Exceptional
Poor
83.3%
IN LABOR FORCE | AGE 45-54
94.4/ 100
METRIC RATING
98th/ 347
METRIC RANK
82.4%
IN LABOR FORCE | AGE 45-54
11.6/ 100
METRIC RATING
203rd/ 347
METRIC RANK

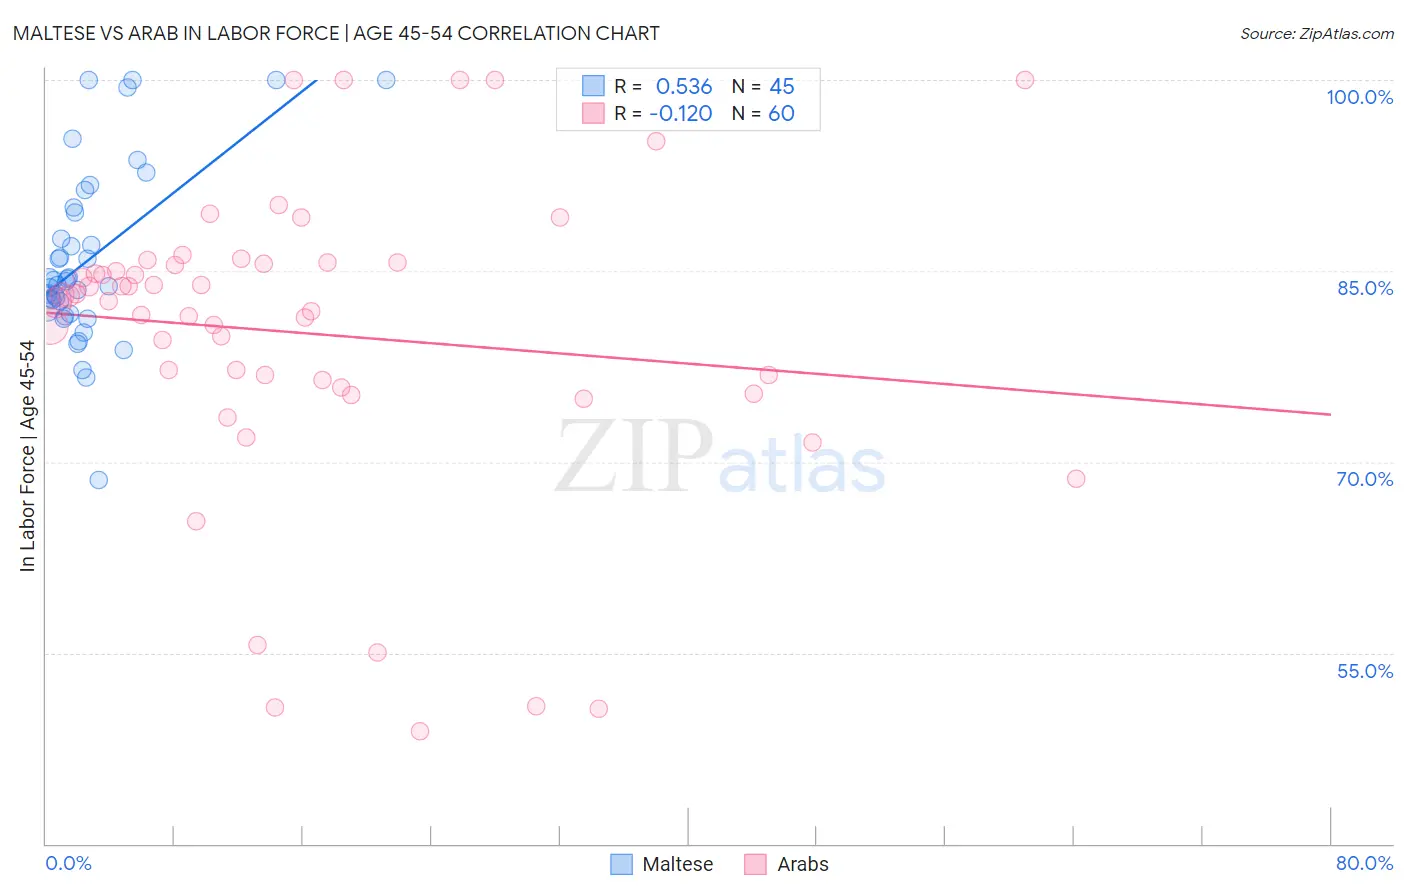
Maltese vs Arab In Labor Force | Age 45-54 Correlation Chart

The statistical analysis conducted on geographies consisting of 126,435,946 people shows a substantial positive correlation between the proportion of Maltese and labor force participation rate among population between the ages 45 and 54 in the United States with a correlation coefficient (R) of 0.536 and weighted average of 83.3%. Similarly, the statistical analysis conducted on geographies consisting of 486,354,734 people shows a poor negative correlation between the proportion of Arabs and labor force participation rate among population between the ages 45 and 54 in the United States with a correlation coefficient (R) of -0.120 and weighted average of 82.4%, a difference of 1.1%.
Maltese vs Arab In Labor Force | Age 45-54

In Labor Force | Age 45-54 Correlation Summary

MeasurementMalteseArab
Minimum68.6%48.8%
Maximum100.0%100.0%
Range31.4%51.2%
Mean85.9%80.1%
Median84.2%82.8%
Interquartile 25% (IQ1)81.9%76.1%
Interquartile 75% (IQ3)89.8%85.6%
Interquartile Range (IQR)7.9%9.5%
Standard Deviation (Sample)6.9%12.0%
Standard Deviation (Population)6.8%11.9%

Similar Demographics by In Labor Force | Age 45-54

Demographics Similar to Maltese by In Labor Force | Age 45-54

In terms of in labor force | age 45-54, the demographic groups most similar to Maltese are Palestinian (83.3%, a difference of 0.010%), Immigrants from Middle Africa (83.3%, a difference of 0.010%), Mongolian (83.3%, a difference of 0.010%), Immigrants from Belarus (83.3%, a difference of 0.010%), and Argentinean (83.3%, a difference of 0.020%).
DemographicsRating | RankIn Labor Force | Age 45-54
South Americans
95.5
/100
|
#91
Exceptional
83.3%
Danes
95.3
/100
|
#92
Exceptional
83.3%
Italians
95.1
/100
|
#93
Exceptional
83.3%
Argentineans
94.9
/100
|
#94
Exceptional
83.3%
Immigrants | Argentina
94.9
/100
|
#95
Exceptional
83.3%
Immigrants | Kuwait
94.8
/100
|
#96
Exceptional
83.3%
Palestinians
94.8
/100
|
#97
Exceptional
83.3%
Maltese
94.4
/100
|
#98
Exceptional
83.3%
Immigrants | Middle Africa
94.3
/100
|
#99
Exceptional
83.3%
Mongolians
94.2
/100
|
#100
Exceptional
83.3%
Immigrants | Belarus
94.1
/100
|
#101
Exceptional
83.3%
Immigrants | Singapore
93.9
/100
|
#102
Exceptional
83.3%
Albanians
93.9
/100
|
#103
Exceptional
83.3%
Immigrants | Romania
93.8
/100
|
#104
Exceptional
83.3%
Immigrants | South America
93.5
/100
|
#105
Exceptional
83.2%

Demographics Similar to Arabs by In Labor Force | Age 45-54

In terms of in labor force | age 45-54, the demographic groups most similar to Arabs are Immigrants from Western Europe (82.4%, a difference of 0.010%), Senegalese (82.4%, a difference of 0.050%), Immigrants from Western Asia (82.4%, a difference of 0.060%), Welsh (82.3%, a difference of 0.060%), and French Canadian (82.5%, a difference of 0.070%).
DemographicsRating | RankIn Labor Force | Age 45-54
Immigrants | North America
18.8
/100
|
#196
Poor
82.5%
Lebanese
18.2
/100
|
#197
Poor
82.5%
Immigrants | Denmark
17.9
/100
|
#198
Poor
82.5%
Moroccans
15.7
/100
|
#199
Poor
82.5%
French Canadians
15.4
/100
|
#200
Poor
82.5%
Canadians
15.1
/100
|
#201
Poor
82.4%
Immigrants | Western Asia
14.9
/100
|
#202
Poor
82.4%
Arabs
11.6
/100
|
#203
Poor
82.4%
Immigrants | Western Europe
10.9
/100
|
#204
Poor
82.4%
Senegalese
9.5
/100
|
#205
Tragic
82.4%
Welsh
9.2
/100
|
#206
Tragic
82.3%
Immigrants | Cabo Verde
8.6
/100
|
#207
Tragic
82.3%
Native Hawaiians
8.5
/100
|
#208
Tragic
82.3%
Immigrants | Lebanon
7.4
/100
|
#209
Tragic
82.3%
Immigrants | Bahamas
7.1
/100
|
#210
Tragic
82.3%