Luxembourger vs Paiute In Labor Force | Age > 16
COMPARE
Luxembourger
Paiute
In Labor Force | Age > 16
In Labor Force | Age > 16 Comparison
Luxembourgers
Paiute
66.7%
IN LABOR FORCE | AGE > 16
100.0/ 100
METRIC RATING
43rd/ 347
METRIC RANK
60.7%
IN LABOR FORCE | AGE > 16
0.0/ 100
METRIC RATING
333rd/ 347
METRIC RANK
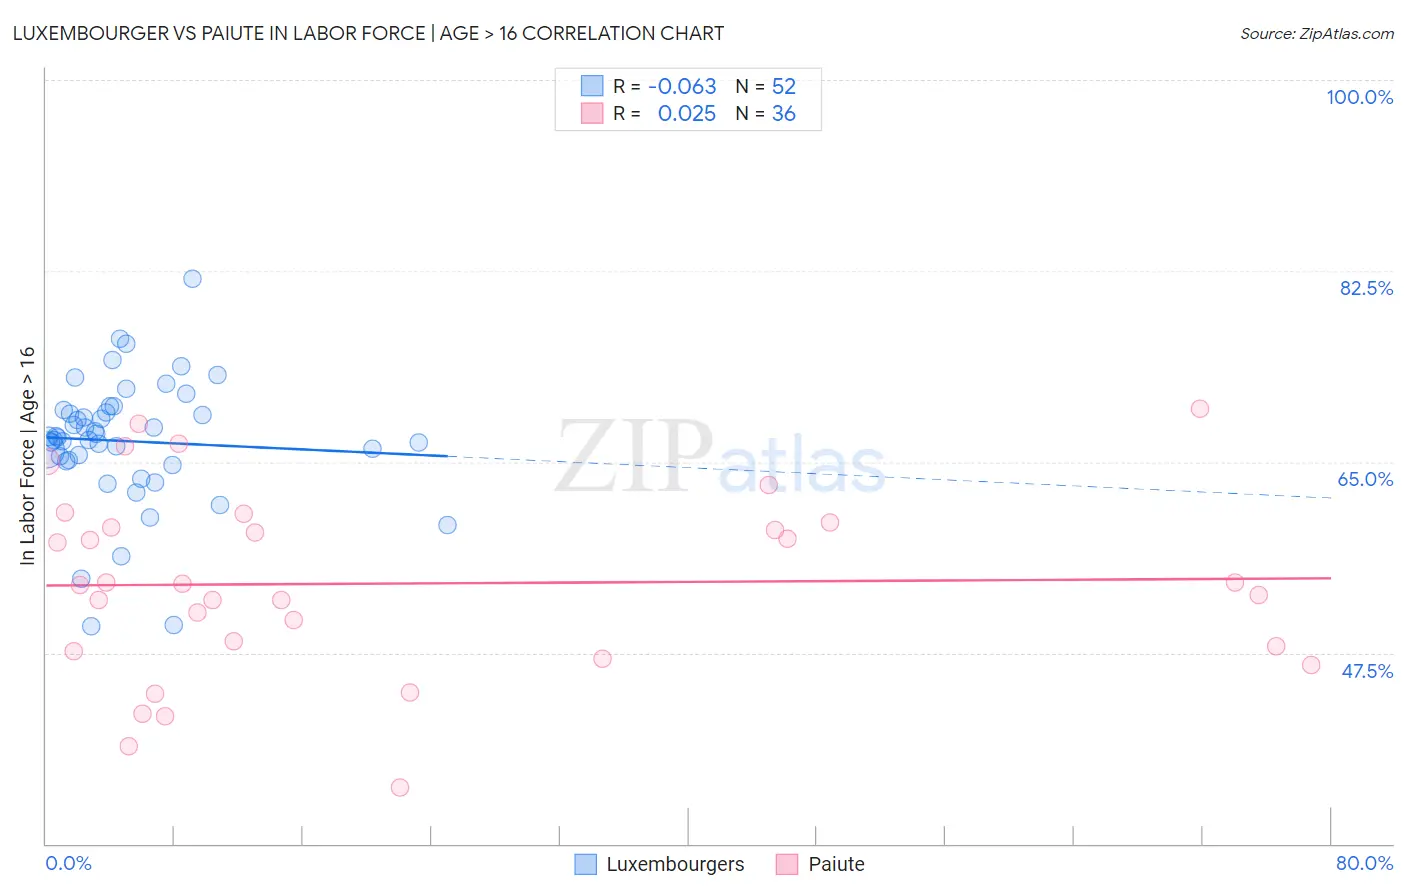
Luxembourger vs Paiute In Labor Force | Age > 16 Correlation Chart
The statistical analysis conducted on geographies consisting of 144,682,986 people shows a slight negative correlation between the proportion of Luxembourgers and labor force participation rate among population ages 16 and over in the United States with a correlation coefficient (R) of -0.063 and weighted average of 66.7%. Similarly, the statistical analysis conducted on geographies consisting of 58,401,251 people shows no correlation between the proportion of Paiute and labor force participation rate among population ages 16 and over in the United States with a correlation coefficient (R) of 0.025 and weighted average of 60.7%, a difference of 9.9%.
In Labor Force | Age > 16 Correlation Summary
| Measurement | Luxembourger | Paiute |
| Minimum | 50.0% | 35.1% |
| Maximum | 81.8% | 69.9% |
| Range | 31.8% | 34.8% |
| Mean | 66.9% | 53.9% |
| Median | 67.3% | 53.7% |
| Interquartile 25% (IQ1) | 65.1% | 47.9% |
| Interquartile 75% (IQ3) | 69.7% | 59.2% |
| Interquartile Range (IQR) | 4.5% | 11.4% |
| Standard Deviation (Sample) | 5.9% | 8.5% |
| Standard Deviation (Population) | 5.8% | 8.4% |
Similar Demographics by In Labor Force | Age > 16
Demographics Similar to Luxembourgers by In Labor Force | Age > 16
In terms of in labor force | age > 16, the demographic groups most similar to Luxembourgers are Senegalese (66.7%, a difference of 0.020%), Immigrants from Pakistan (66.7%, a difference of 0.050%), Immigrants from Brazil (66.7%, a difference of 0.10%), Immigrants from El Salvador (66.8%, a difference of 0.12%), and Immigrants from Zimbabwe (66.8%, a difference of 0.12%).
| Demographics | Rating | Rank | In Labor Force | Age > 16 |
| Immigrants | Western Africa | 100.0 /100 | #36 | Exceptional 67.1% |
| Immigrants | Afghanistan | 100.0 /100 | #37 | Exceptional 67.0% |
| Immigrants | Nigeria | 100.0 /100 | #38 | Exceptional 66.9% |
| Salvadorans | 100.0 /100 | #39 | Exceptional 66.8% |
| Immigrants | El Salvador | 100.0 /100 | #40 | Exceptional 66.8% |
| Immigrants | Zimbabwe | 100.0 /100 | #41 | Exceptional 66.8% |
| Senegalese | 100.0 /100 | #42 | Exceptional 66.7% |
| Luxembourgers | 100.0 /100 | #43 | Exceptional 66.7% |
| Immigrants | Pakistan | 100.0 /100 | #44 | Exceptional 66.7% |
| Immigrants | Brazil | 100.0 /100 | #45 | Exceptional 66.7% |
| Brazilians | 100.0 /100 | #46 | Exceptional 66.6% |
| Immigrants | Bulgaria | 100.0 /100 | #47 | Exceptional 66.6% |
| Nigerians | 100.0 /100 | #48 | Exceptional 66.6% |
| Immigrants | Northern Africa | 100.0 /100 | #49 | Exceptional 66.6% |
| Cape Verdeans | 100.0 /100 | #50 | Exceptional 66.6% |
Demographics Similar to Paiute by In Labor Force | Age > 16
In terms of in labor force | age > 16, the demographic groups most similar to Paiute are Apache (60.7%, a difference of 0.050%), Crow (60.8%, a difference of 0.080%), Native/Alaskan (60.6%, a difference of 0.23%), Ute (60.9%, a difference of 0.26%), and Menominee (60.6%, a difference of 0.26%).
| Demographics | Rating | Rank | In Labor Force | Age > 16 |
| Sioux | 0.0 /100 | #326 | Tragic 61.8% |
| Cajuns | 0.0 /100 | #327 | Tragic 61.8% |
| Dutch West Indians | 0.0 /100 | #328 | Tragic 61.7% |
| Choctaw | 0.0 /100 | #329 | Tragic 61.5% |
| Creek | 0.0 /100 | #330 | Tragic 61.3% |
| Ute | 0.0 /100 | #331 | Tragic 60.9% |
| Crow | 0.0 /100 | #332 | Tragic 60.8% |
| Paiute | 0.0 /100 | #333 | Tragic 60.7% |
| Apache | 0.0 /100 | #334 | Tragic 60.7% |
| Natives/Alaskans | 0.0 /100 | #335 | Tragic 60.6% |
| Menominee | 0.0 /100 | #336 | Tragic 60.6% |
| Colville | 0.0 /100 | #337 | Tragic 59.8% |
| Immigrants | Yemen | 0.0 /100 | #338 | Tragic 59.6% |
| Houma | 0.0 /100 | #339 | Tragic 59.5% |
| Pueblo | 0.0 /100 | #340 | Tragic 59.3% |