Liberian vs Thai In Labor Force | Age 16-19
COMPARE
Liberian
Thai
In Labor Force | Age 16-19
In Labor Force | Age 16-19 Comparison
Liberians
Thais
41.8%
IN LABOR FORCE | AGE 16-19
100.0/ 100
METRIC RATING
33rd/ 347
METRIC RANK
34.6%
IN LABOR FORCE | AGE 16-19
1.2/ 100
METRIC RATING
258th/ 347
METRIC RANK
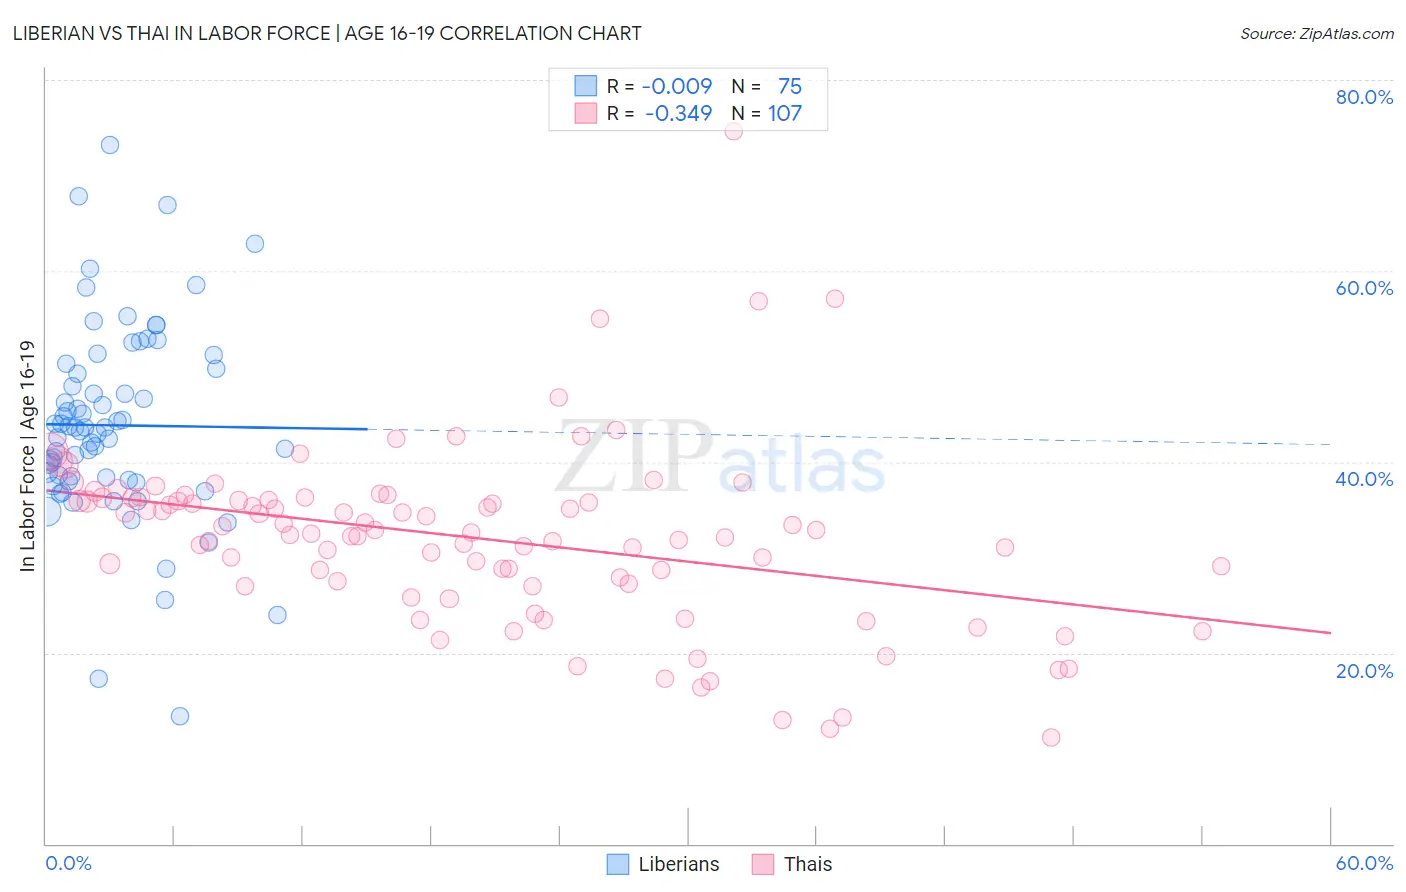
Liberian vs Thai In Labor Force | Age 16-19 Correlation Chart
The statistical analysis conducted on geographies consisting of 118,043,007 people shows no correlation between the proportion of Liberians and labor force participation rate among population between the ages 16 and 19 in the United States with a correlation coefficient (R) of -0.009 and weighted average of 41.8%. Similarly, the statistical analysis conducted on geographies consisting of 474,909,482 people shows a mild negative correlation between the proportion of Thais and labor force participation rate among population between the ages 16 and 19 in the United States with a correlation coefficient (R) of -0.349 and weighted average of 34.6%, a difference of 21.0%.
In Labor Force | Age 16-19 Correlation Summary
| Measurement | Liberian | Thai |
| Minimum | 13.3% | 11.1% |
| Maximum | 73.2% | 74.6% |
| Range | 59.9% | 63.5% |
| Mean | 43.8% | 32.0% |
| Median | 43.6% | 32.6% |
| Interquartile 25% (IQ1) | 38.1% | 27.3% |
| Interquartile 75% (IQ3) | 49.7% | 36.2% |
| Interquartile Range (IQR) | 11.6% | 9.0% |
| Standard Deviation (Sample) | 10.3% | 9.4% |
| Standard Deviation (Population) | 10.2% | 9.4% |
Similar Demographics by In Labor Force | Age 16-19
Demographics Similar to Liberians by In Labor Force | Age 16-19
In terms of in labor force | age 16-19, the demographic groups most similar to Liberians are Immigrants from Bosnia and Herzegovina (41.8%, a difference of 0.080%), Yugoslavian (41.8%, a difference of 0.10%), Czechoslovakian (41.9%, a difference of 0.14%), Immigrants from the Azores (41.7%, a difference of 0.24%), and Immigrants from Congo (41.7%, a difference of 0.32%).
| Demographics | Rating | Rank | In Labor Force | Age 16-19 |
| English | 100.0 /100 | #26 | Exceptional 42.4% |
| Welsh | 100.0 /100 | #27 | Exceptional 42.3% |
| Poles | 100.0 /100 | #28 | Exceptional 42.1% |
| French | 100.0 /100 | #29 | Exceptional 42.1% |
| Scottish | 100.0 /100 | #30 | Exceptional 42.0% |
| Irish | 100.0 /100 | #31 | Exceptional 42.0% |
| Czechoslovakians | 100.0 /100 | #32 | Exceptional 41.9% |
| Liberians | 100.0 /100 | #33 | Exceptional 41.8% |
| Immigrants | Bosnia and Herzegovina | 100.0 /100 | #34 | Exceptional 41.8% |
| Yugoslavians | 100.0 /100 | #35 | Exceptional 41.8% |
| Immigrants | Azores | 100.0 /100 | #36 | Exceptional 41.7% |
| Immigrants | Congo | 100.0 /100 | #37 | Exceptional 41.7% |
| Sioux | 100.0 /100 | #38 | Exceptional 41.5% |
| Scotch-Irish | 100.0 /100 | #39 | Exceptional 41.5% |
| Immigrants | Liberia | 100.0 /100 | #40 | Exceptional 41.5% |
Demographics Similar to Thais by In Labor Force | Age 16-19
In terms of in labor force | age 16-19, the demographic groups most similar to Thais are Immigrants from South Central Asia (34.6%, a difference of 0.010%), Immigrants from Egypt (34.6%, a difference of 0.010%), Immigrants (34.6%, a difference of 0.020%), Egyptian (34.5%, a difference of 0.10%), and Peruvian (34.6%, a difference of 0.12%).
| Demographics | Rating | Rank | In Labor Force | Age 16-19 |
| Immigrants | Western Asia | 2.0 /100 | #251 | Tragic 34.8% |
| Immigrants | Chile | 2.0 /100 | #252 | Tragic 34.8% |
| Immigrants | Japan | 1.5 /100 | #253 | Tragic 34.7% |
| Bahamians | 1.4 /100 | #254 | Tragic 34.6% |
| Peruvians | 1.4 /100 | #255 | Tragic 34.6% |
| Immigrants | South Central Asia | 1.3 /100 | #256 | Tragic 34.6% |
| Immigrants | Egypt | 1.2 /100 | #257 | Tragic 34.6% |
| Thais | 1.2 /100 | #258 | Tragic 34.6% |
| Immigrants | Immigrants | 1.2 /100 | #259 | Tragic 34.6% |
| Egyptians | 1.2 /100 | #260 | Tragic 34.5% |
| Salvadorans | 1.1 /100 | #261 | Tragic 34.5% |
| Hispanics or Latinos | 1.1 /100 | #262 | Tragic 34.5% |
| Burmese | 1.1 /100 | #263 | Tragic 34.5% |
| Immigrants | Uruguay | 0.9 /100 | #264 | Tragic 34.4% |
| Immigrants | El Salvador | 0.7 /100 | #265 | Tragic 34.3% |