Lebanese vs Blackfeet In Labor Force | Age 45-54
COMPARE
Lebanese
Blackfeet
In Labor Force | Age 45-54
In Labor Force | Age 45-54 Comparison
Lebanese
Blackfeet
82.5%
IN LABOR FORCE | AGE 45-54
18.2/ 100
METRIC RATING
197th/ 347
METRIC RANK
80.0%
IN LABOR FORCE | AGE 45-54
0.0/ 100
METRIC RATING
307th/ 347
METRIC RANK
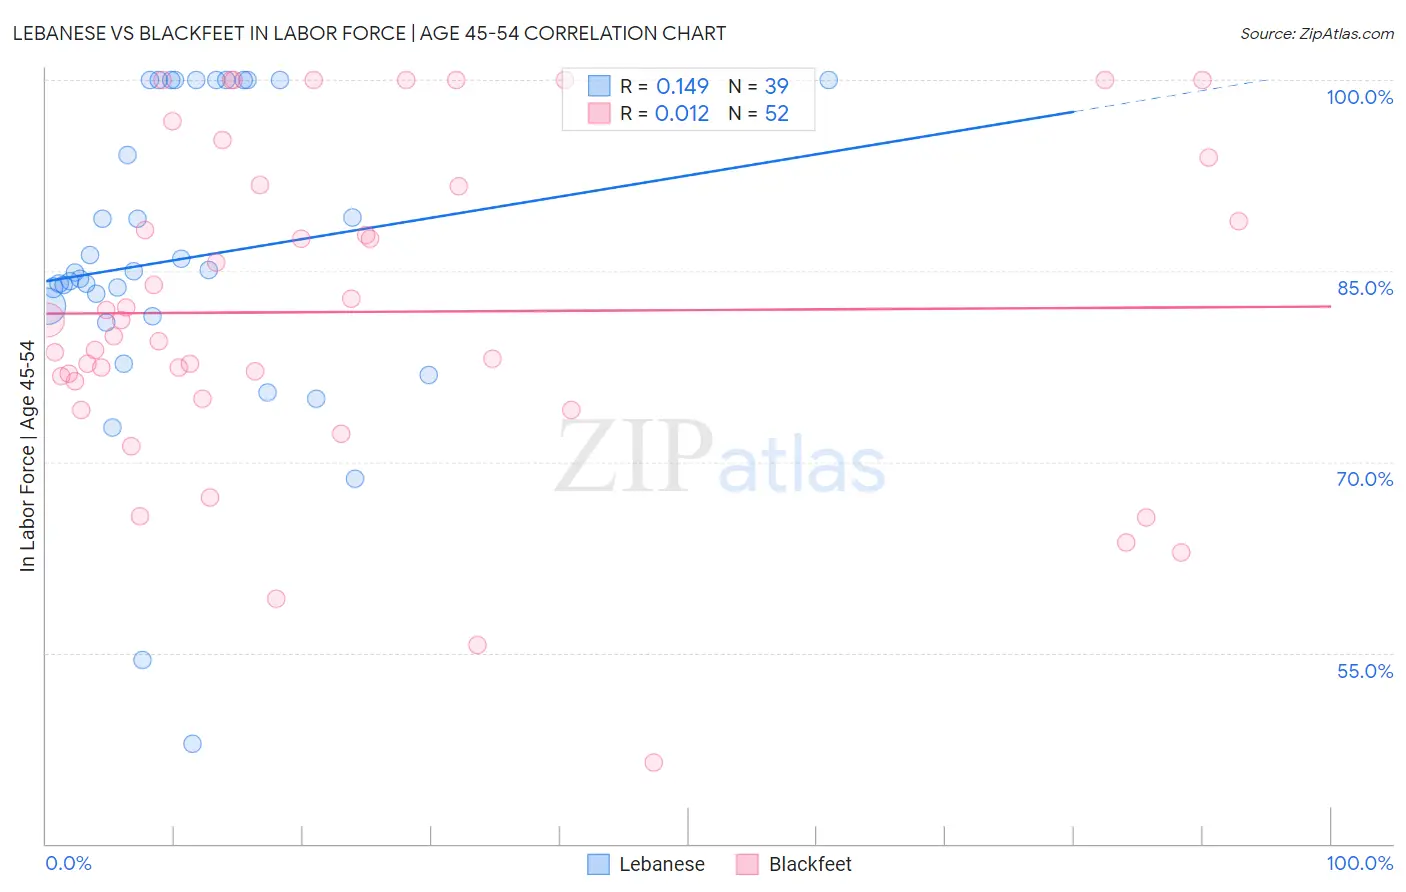
Lebanese vs Blackfeet In Labor Force | Age 45-54 Correlation Chart
The statistical analysis conducted on geographies consisting of 401,315,203 people shows a poor positive correlation between the proportion of Lebanese and labor force participation rate among population between the ages 45 and 54 in the United States with a correlation coefficient (R) of 0.149 and weighted average of 82.5%. Similarly, the statistical analysis conducted on geographies consisting of 309,460,810 people shows no correlation between the proportion of Blackfeet and labor force participation rate among population between the ages 45 and 54 in the United States with a correlation coefficient (R) of 0.012 and weighted average of 80.0%, a difference of 3.1%.
In Labor Force | Age 45-54 Correlation Summary
| Measurement | Lebanese | Blackfeet |
| Minimum | 47.9% | 46.4% |
| Maximum | 100.0% | 100.0% |
| Range | 52.1% | 53.6% |
| Mean | 86.0% | 81.8% |
| Median | 84.9% | 80.5% |
| Interquartile 25% (IQ1) | 81.5% | 75.6% |
| Interquartile 75% (IQ3) | 100.0% | 91.7% |
| Interquartile Range (IQR) | 18.5% | 16.1% |
| Standard Deviation (Sample) | 12.2% | 12.8% |
| Standard Deviation (Population) | 12.0% | 12.7% |
Similar Demographics by In Labor Force | Age 45-54
Demographics Similar to Lebanese by In Labor Force | Age 45-54
In terms of in labor force | age 45-54, the demographic groups most similar to Lebanese are Immigrants from North America (82.5%, a difference of 0.010%), Immigrants from Denmark (82.5%, a difference of 0.010%), Immigrants from Norway (82.5%, a difference of 0.030%), Immigrants from Canada (82.5%, a difference of 0.030%), and Immigrants from Iraq (82.5%, a difference of 0.040%).
| Demographics | Rating | Rank | In Labor Force | Age 45-54 |
| British | 25.7 /100 | #190 | Fair 82.6% |
| Armenians | 23.2 /100 | #191 | Fair 82.5% |
| Immigrants | Iraq | 20.9 /100 | #192 | Fair 82.5% |
| Australians | 20.8 /100 | #193 | Fair 82.5% |
| Immigrants | Norway | 20.7 /100 | #194 | Fair 82.5% |
| Immigrants | Canada | 20.0 /100 | #195 | Fair 82.5% |
| Immigrants | North America | 18.8 /100 | #196 | Poor 82.5% |
| Lebanese | 18.2 /100 | #197 | Poor 82.5% |
| Immigrants | Denmark | 17.9 /100 | #198 | Poor 82.5% |
| Moroccans | 15.7 /100 | #199 | Poor 82.5% |
| French Canadians | 15.4 /100 | #200 | Poor 82.5% |
| Canadians | 15.1 /100 | #201 | Poor 82.4% |
| Immigrants | Western Asia | 14.9 /100 | #202 | Poor 82.4% |
| Arabs | 11.6 /100 | #203 | Poor 82.4% |
| Immigrants | Western Europe | 10.9 /100 | #204 | Poor 82.4% |
Demographics Similar to Blackfeet by In Labor Force | Age 45-54
In terms of in labor force | age 45-54, the demographic groups most similar to Blackfeet are Central American Indian (80.0%, a difference of 0.040%), Potawatomi (80.0%, a difference of 0.070%), Spanish American (80.1%, a difference of 0.080%), Hispanic or Latino (80.1%, a difference of 0.12%), and Immigrants from Dominican Republic (80.1%, a difference of 0.12%).
| Demographics | Rating | Rank | In Labor Force | Age 45-54 |
| Fijians | 0.0 /100 | #300 | Tragic 80.2% |
| Spanish American Indians | 0.0 /100 | #301 | Tragic 80.2% |
| Immigrants | Central America | 0.0 /100 | #302 | Tragic 80.2% |
| Immigrants | Azores | 0.0 /100 | #303 | Tragic 80.1% |
| Hispanics or Latinos | 0.0 /100 | #304 | Tragic 80.1% |
| Immigrants | Dominican Republic | 0.0 /100 | #305 | Tragic 80.1% |
| Spanish Americans | 0.0 /100 | #306 | Tragic 80.1% |
| Blackfeet | 0.0 /100 | #307 | Tragic 80.0% |
| Central American Indians | 0.0 /100 | #308 | Tragic 80.0% |
| Potawatomi | 0.0 /100 | #309 | Tragic 80.0% |
| Inupiat | 0.0 /100 | #310 | Tragic 79.9% |
| Mexicans | 0.0 /100 | #311 | Tragic 79.8% |
| Immigrants | Mexico | 0.0 /100 | #312 | Tragic 79.7% |
| Colville | 0.0 /100 | #313 | Tragic 79.5% |
| Ottawa | 0.0 /100 | #314 | Tragic 79.5% |