Korean vs Immigrants from Uzbekistan In Labor Force | Age 35-44
COMPARE
Korean
Immigrants from Uzbekistan
In Labor Force | Age 35-44
In Labor Force | Age 35-44 Comparison
Koreans
Immigrants from Uzbekistan
84.3%
IN LABOR FORCE | AGE 35-44
36.3/ 100
METRIC RATING
182nd/ 347
METRIC RANK
84.2%
IN LABOR FORCE | AGE 35-44
22.8/ 100
METRIC RATING
202nd/ 347
METRIC RANK
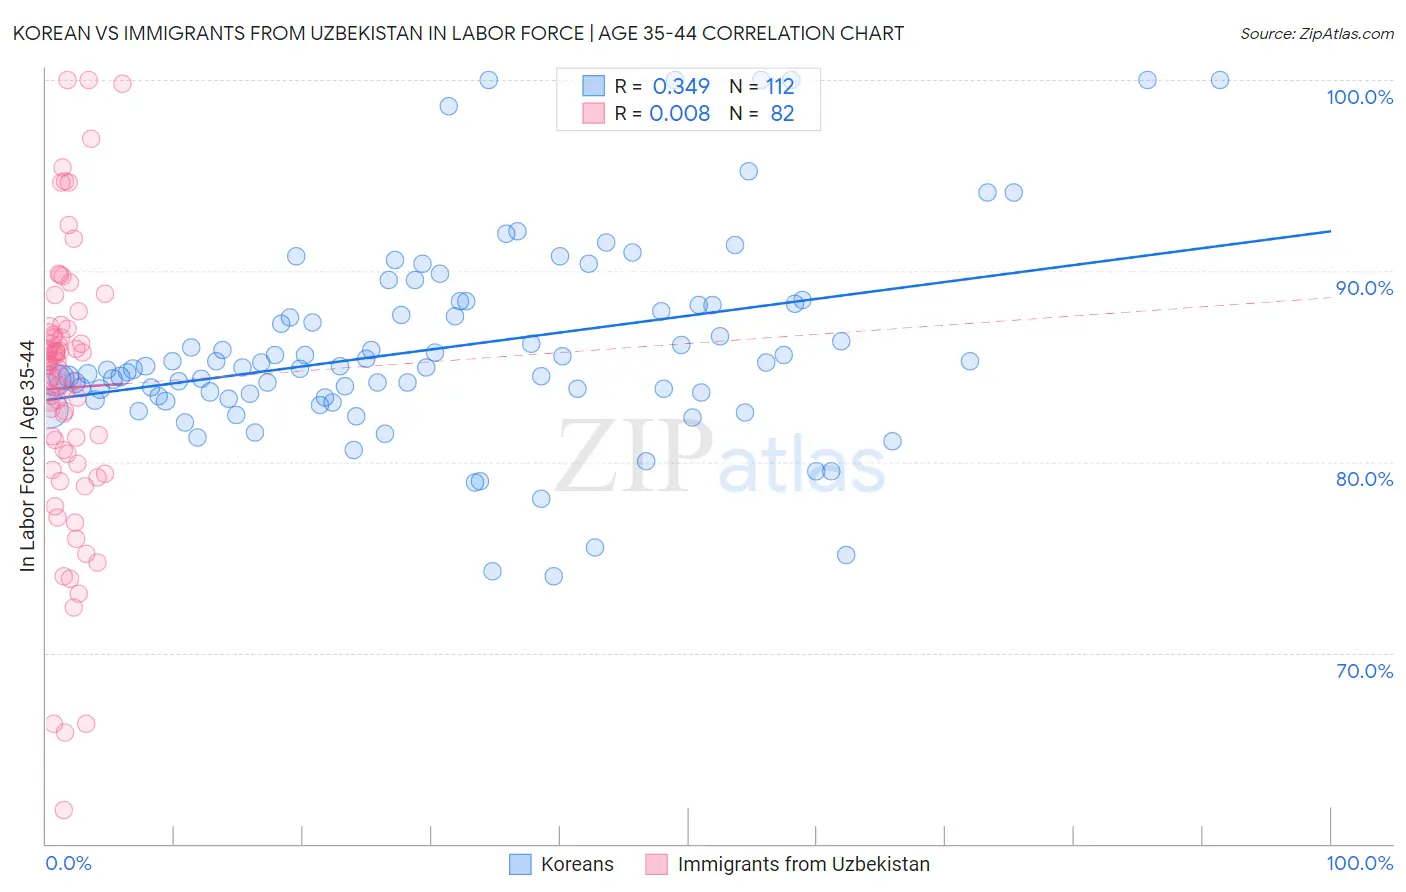
Korean vs Immigrants from Uzbekistan In Labor Force | Age 35-44 Correlation Chart
The statistical analysis conducted on geographies consisting of 510,522,500 people shows a mild positive correlation between the proportion of Koreans and labor force participation rate among population between the ages 35 and 44 in the United States with a correlation coefficient (R) of 0.349 and weighted average of 84.3%. Similarly, the statistical analysis conducted on geographies consisting of 118,733,606 people shows no correlation between the proportion of Immigrants from Uzbekistan and labor force participation rate among population between the ages 35 and 44 in the United States with a correlation coefficient (R) of 0.008 and weighted average of 84.2%, a difference of 0.11%.
In Labor Force | Age 35-44 Correlation Summary
| Measurement | Korean | Immigrants from Uzbekistan |
| Minimum | 74.0% | 61.8% |
| Maximum | 100.0% | 100.0% |
| Range | 26.0% | 38.2% |
| Mean | 86.0% | 83.9% |
| Median | 84.9% | 85.0% |
| Interquartile 25% (IQ1) | 83.4% | 80.4% |
| Interquartile 75% (IQ3) | 88.2% | 86.8% |
| Interquartile Range (IQR) | 4.8% | 6.4% |
| Standard Deviation (Sample) | 5.2% | 7.3% |
| Standard Deviation (Population) | 5.2% | 7.2% |
Demographics Similar to Koreans and Immigrants from Uzbekistan by In Labor Force | Age 35-44
In terms of in labor force | age 35-44, the demographic groups most similar to Koreans are Barbadian (84.3%, a difference of 0.0%), Armenian (84.3%, a difference of 0.010%), Costa Rican (84.3%, a difference of 0.010%), Australian (84.3%, a difference of 0.010%), and Dutch (84.3%, a difference of 0.010%). Similarly, the demographic groups most similar to Immigrants from Uzbekistan are Syrian (84.2%, a difference of 0.0%), Moroccan (84.2%, a difference of 0.0%), British (84.2%, a difference of 0.0%), Ecuadorian (84.2%, a difference of 0.010%), and Immigrants from England (84.2%, a difference of 0.020%).
| Demographics | Rating | Rank | In Labor Force | Age 35-44 |
| Koreans | 36.3 /100 | #182 | Fair 84.3% |
| Barbadians | 36.2 /100 | #183 | Fair 84.3% |
| Armenians | 35.6 /100 | #184 | Fair 84.3% |
| Costa Ricans | 35.3 /100 | #185 | Fair 84.3% |
| Australians | 35.1 /100 | #186 | Fair 84.3% |
| Dutch | 34.8 /100 | #187 | Fair 84.3% |
| South Africans | 34.1 /100 | #188 | Fair 84.3% |
| Immigrants | Denmark | 33.7 /100 | #189 | Fair 84.3% |
| Portuguese | 31.9 /100 | #190 | Fair 84.3% |
| Immigrants | Philippines | 27.9 /100 | #191 | Fair 84.2% |
| Immigrants | Vietnam | 27.4 /100 | #192 | Fair 84.2% |
| Hungarians | 26.8 /100 | #193 | Fair 84.2% |
| Immigrants | Indonesia | 25.7 /100 | #194 | Fair 84.2% |
| Immigrants | Caribbean | 25.7 /100 | #195 | Fair 84.2% |
| Immigrants | England | 25.0 /100 | #196 | Fair 84.2% |
| Immigrants | Western Europe | 24.7 /100 | #197 | Fair 84.2% |
| Ecuadorians | 24.0 /100 | #198 | Fair 84.2% |
| Syrians | 23.2 /100 | #199 | Fair 84.2% |
| Moroccans | 23.2 /100 | #200 | Fair 84.2% |
| British | 23.0 /100 | #201 | Fair 84.2% |
| Immigrants | Uzbekistan | 22.8 /100 | #202 | Fair 84.2% |