Italian vs Immigrants from Russia In Labor Force | Age 20-24

COMPARE

Italian
Race
Ancestry
AfghanAfricanAlaska NativeAlaskan AthabascanAlbanianAleutAlsatianAmericanApacheArabArapahoArgentineanArmenianAssyrian/Chaldean/SyriacAustralianAustrianBahamianBangladeshiBarbadianBasqueBelgianBelizeanBermudanBhutaneseBlackfeetBolivianBrazilianBritishBritish West IndianBulgarianBurmeseCajunCambodianCanadianCape VerdeanCarpatho RusynCelticCentral AmericanCentral American IndianCherokeeCheyenneChickasawChileanChineseChippewaChoctawColombianColvilleComancheCosta RicanCreeCreekCroatianCrowCubanCypriotCzechCzechoslovakianDanishDelawareDominicanDutchDutch West IndianEastern EuropeanEcuadorianEgyptianEnglishEstonianEthiopianEuropeanFijianFilipinoFinnishFrenchFrench American IndianFrench CanadianGermanGerman RussianGhanaianGreekGuamanian/ChamorroGuatemalanGuyaneseHaitianHmongHonduranHopiHoumaHungarianIcelanderIndian (Asian)IndonesianInupiatIranianIraqiIrishIroquoisIsraeliItalianJamaicanJapaneseJordanianKenyanKiowaKoreanLaotianLatvianLebaneseLiberianLithuanianLumbeeLuxembourgerMacedonianMalaysianMalteseMarshalleseMenomineeMexicanMexican American IndianMongolianMoroccanNative HawaiianNavajoNepaleseNew ZealanderNicaraguanNigerianNorthern EuropeanNorwegianOkinawanOsageOttawaPaiutePakistaniPalestinianPanamanianParaguayanPennsylvania GermanPeruvianPimaPolishPortuguesePotawatomiPuebloPuerto RicanPuget Sound SalishRomanianRussianSalvadoranSamoanScandinavianScotch-IrishScottishSeminoleSenegaleseSerbianShoshoneSierra LeoneanSiouxSlavicSlovakSloveneSomaliSouth AfricanSouth AmericanSouth American IndianSoviet UnionSpaniardSpanishSpanish AmericanSpanish American IndianSri LankanSubsaharan AfricanSudaneseSwedishSwissSyrianTaiwaneseThaiTlingit-HaidaTohono O'OdhamTonganTrinidadian and TobagonianTsimshianTurkishU.S. Virgin IslanderUgandanUkrainianUruguayanUteVenezuelanVietnameseWelshWest IndianYakamaYaquiYugoslavianYumanYup'ikZimbabwean
Immigration
NonimmigrantsImmigrantsAfghanistanAfricaAlbaniaArgentinaArmeniaAsiaAustraliaAustriaBahamasBangladeshBarbadosBelarusBelgiumBelizeBoliviaBosnia and HerzegovinaBrazilBulgariaBurma/MyanmarCabo VerdeCambodiaCameroonCanadaCaribbeanCentral AmericaChileChinaColombiaCongoCosta RicaCroatiaCubaCzechoslovakiaDenmarkDominicaDominican RepublicEastern AfricaEastern AsiaEastern EuropeEcuadorEgyptEl SalvadorEnglandEritreaEthiopiaEuropeFijiFranceGermanyGhanaGreeceGrenadaGuatemalaGuyanaHaitiHondurasHong KongHungaryIndiaIndonesiaIranIraqIrelandIsraelItalyJamaicaJapanJordanKazakhstanKenyaKoreaKuwaitLaosLatin AmericaLatviaLebanonLiberiaLithuaniaMalaysiaMexicoMicronesiaMiddle AfricaMoldovaMoroccoNepalNetherlandsNicaraguaNigeriaNorth AmericaNorth MacedoniaNorthern AfricaNorthern EuropeNorwayOceaniaPakistanPanamaPeruPhilippinesPolandPortugalRomaniaSaudi ArabiaScotlandSenegalSerbiaSierra LeoneSingaporeSomaliaSouth AfricaSouth AmericaSouth Central AsiaSouth Eastern AsiaSouthern EuropeSpainSri LankaSt. Vincent and the GrenadinesSudanSwedenSwitzerlandSyriaTaiwanThailandTrinidad and TobagoTurkeyUgandaUkraineUruguayUzbekistanVenezuelaVietnamWest IndiesWestern AfricaWestern AsiaWestern EuropeYemenZaireZimbabweAzores
Immigrants from Russia
Race
Ancestry
AfghanAfricanAlaska NativeAlaskan AthabascanAlbanianAleutAlsatianAmericanApacheArabArapahoArgentineanArmenianAssyrian/Chaldean/SyriacAustralianAustrianBahamianBangladeshiBarbadianBasqueBelgianBelizeanBermudanBhutaneseBlackfeetBolivianBrazilianBritishBritish West IndianBulgarianBurmeseCajunCambodianCanadianCape VerdeanCarpatho RusynCelticCentral AmericanCentral American IndianCherokeeCheyenneChickasawChileanChineseChippewaChoctawColombianColvilleComancheCosta RicanCreeCreekCroatianCrowCubanCypriotCzechCzechoslovakianDanishDelawareDominicanDutchDutch West IndianEastern EuropeanEcuadorianEgyptianEnglishEstonianEthiopianEuropeanFijianFilipinoFinnishFrenchFrench American IndianFrench CanadianGermanGerman RussianGhanaianGreekGuamanian/ChamorroGuatemalanGuyaneseHaitianHmongHonduranHopiHoumaHungarianIcelanderIndian (Asian)IndonesianInupiatIranianIraqiIrishIroquoisIsraeliJamaicanJapaneseJordanianKenyanKiowaKoreanLaotianLatvianLebaneseLiberianLithuanianLumbeeLuxembourgerMacedonianMalaysianMalteseMarshalleseMenomineeMexicanMexican American IndianMongolianMoroccanNative HawaiianNavajoNepaleseNew ZealanderNicaraguanNigerianNorthern EuropeanNorwegianOkinawanOsageOttawaPaiutePakistaniPalestinianPanamanianParaguayanPennsylvania GermanPeruvianPimaPolishPortuguesePotawatomiPuebloPuerto RicanPuget Sound SalishRomanianRussianSalvadoranSamoanScandinavianScotch-IrishScottishSeminoleSenegaleseSerbianShoshoneSierra LeoneanSiouxSlavicSlovakSloveneSomaliSouth AfricanSouth AmericanSouth American IndianSoviet UnionSpaniardSpanishSpanish AmericanSpanish American IndianSri LankanSubsaharan AfricanSudaneseSwedishSwissSyrianTaiwaneseThaiTlingit-HaidaTohono O'OdhamTonganTrinidadian and TobagonianTsimshianTurkishU.S. Virgin IslanderUgandanUkrainianUruguayanUteVenezuelanVietnameseWelshWest IndianYakamaYaquiYugoslavianYumanYup'ikZimbabwean
Immigration
NonimmigrantsImmigrantsAfghanistanAfricaAlbaniaArgentinaArmeniaAsiaAustraliaAustriaBahamasBangladeshBarbadosBelarusBelgiumBelizeBoliviaBosnia and HerzegovinaBrazilBulgariaBurma/MyanmarCabo VerdeCambodiaCameroonCanadaCaribbeanCentral AmericaChileChinaColombiaCongoCosta RicaCroatiaCubaCzechoslovakiaDenmarkDominicaDominican RepublicEastern AfricaEastern AsiaEastern EuropeEcuadorEgyptEl SalvadorEnglandEritreaEthiopiaEuropeFijiFranceGermanyGhanaGreeceGrenadaGuatemalaGuyanaHaitiHondurasHong KongHungaryIndiaIndonesiaIranIraqIrelandIsraelItalyJamaicaJapanJordanKazakhstanKenyaKoreaKuwaitLaosLatin AmericaLatviaLebanonLiberiaLithuaniaMalaysiaMexicoMicronesiaMiddle AfricaMoldovaMoroccoNepalNetherlandsNicaraguaNigeriaNorth AmericaNorth MacedoniaNorthern AfricaNorthern EuropeNorwayOceaniaPakistanPanamaPeruPhilippinesPolandPortugalRomaniaRussiaSaudi ArabiaScotlandSenegalSerbiaSierra LeoneSingaporeSomaliaSouth AfricaSouth AmericaSouth Central AsiaSouth Eastern AsiaSouthern EuropeSpainSri LankaSt. Vincent and the GrenadinesSudanSwedenSwitzerlandSyriaTaiwanThailandTrinidad and TobagoTurkeyUgandaUkraineUruguayUzbekistanVenezuelaVietnamWest IndiesWestern AfricaWestern AsiaWestern EuropeYemenZaireZimbabweAzores
In Labor Force | Age 20-24
Income
Poverty
Unemployment
Labor Participation
Family Structure
Vehicle Availability
Education Level
Disability

In Labor Force | Age 20-24 Comparison

Italians

Immigrants from Russia

Exceptional
Tragic
76.5%
IN LABOR FORCE | AGE 20-24
99.6/ 100
METRIC RATING
80th/ 347
METRIC RANK
73.5%
IN LABOR FORCE | AGE 20-24
0.3/ 100
METRIC RATING
270th/ 347
METRIC RANK

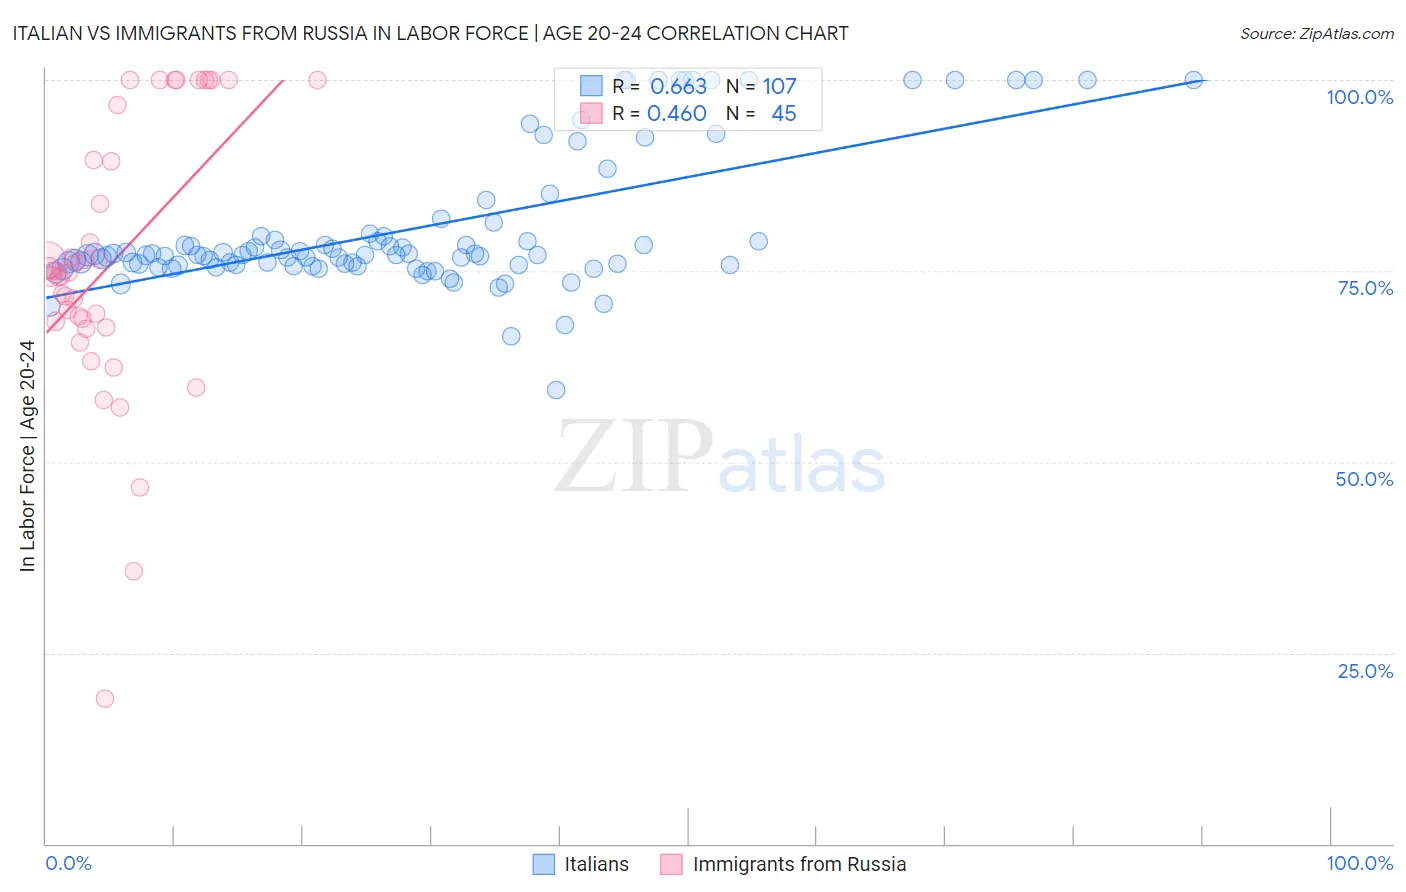
Italian vs Immigrants from Russia In Labor Force | Age 20-24 Correlation Chart

The statistical analysis conducted on geographies consisting of 573,427,196 people shows a significant positive correlation between the proportion of Italians and labor force participation rate among population between the ages 20 and 24 in the United States with a correlation coefficient (R) of 0.663 and weighted average of 76.5%. Similarly, the statistical analysis conducted on geographies consisting of 347,833,174 people shows a moderate positive correlation between the proportion of Immigrants from Russia and labor force participation rate among population between the ages 20 and 24 in the United States with a correlation coefficient (R) of 0.460 and weighted average of 73.5%, a difference of 4.2%.
Italian vs Immigrants from Russia In Labor Force | Age 20-24

In Labor Force | Age 20-24 Correlation Summary

MeasurementItalianImmigrants from Russia
Minimum59.3%19.0%
Maximum100.0%100.0%
Range40.7%81.0%
Mean80.5%76.3%
Median77.1%74.8%
Interquartile 25% (IQ1)75.7%68.0%
Interquartile 75% (IQ3)79.6%93.2%
Interquartile Range (IQR)3.9%25.2%
Standard Deviation (Sample)9.1%18.0%
Standard Deviation (Population)9.0%17.8%

Similar Demographics by In Labor Force | Age 20-24

Demographics Similar to Italians by In Labor Force | Age 20-24

In terms of in labor force | age 20-24, the demographic groups most similar to Italians are Basque (76.5%, a difference of 0.020%), Hmong (76.5%, a difference of 0.020%), Immigrants from Zaire (76.6%, a difference of 0.030%), Immigrants from Cameroon (76.6%, a difference of 0.050%), and Canadian (76.6%, a difference of 0.050%).
DemographicsRating | RankIn Labor Force | Age 20-24
British
99.8
/100
|
#73
Exceptional
76.7%
Cree
99.7
/100
|
#74
Exceptional
76.6%
Immigrants | Middle Africa
99.7
/100
|
#75
Exceptional
76.6%
Immigrants | Moldova
99.6
/100
|
#76
Exceptional
76.6%
Immigrants | Cameroon
99.6
/100
|
#77
Exceptional
76.6%
Canadians
99.6
/100
|
#78
Exceptional
76.6%
Immigrants | Zaire
99.6
/100
|
#79
Exceptional
76.6%
Italians
99.6
/100
|
#80
Exceptional
76.5%
Basques
99.5
/100
|
#81
Exceptional
76.5%
Hmong
99.5
/100
|
#82
Exceptional
76.5%
Carpatho Rusyns
99.4
/100
|
#83
Exceptional
76.5%
Austrians
99.4
/100
|
#84
Exceptional
76.5%
Portuguese
99.3
/100
|
#85
Exceptional
76.4%
Immigrants | Iraq
99.3
/100
|
#86
Exceptional
76.4%
Immigrants | Thailand
99.3
/100
|
#87
Exceptional
76.4%

Demographics Similar to Immigrants from Russia by In Labor Force | Age 20-24

In terms of in labor force | age 20-24, the demographic groups most similar to Immigrants from Russia are Colombian (73.5%, a difference of 0.030%), Immigrants from Indonesia (73.4%, a difference of 0.050%), South American (73.5%, a difference of 0.060%), Belizean (73.4%, a difference of 0.060%), and Cheyenne (73.4%, a difference of 0.090%).
DemographicsRating | RankIn Labor Force | Age 20-24
Immigrants | Asia
0.5
/100
|
#263
Tragic
73.6%
Immigrants | Haiti
0.5
/100
|
#264
Tragic
73.6%
Burmese
0.5
/100
|
#265
Tragic
73.6%
Haitians
0.5
/100
|
#266
Tragic
73.6%
Immigrants | Western Asia
0.4
/100
|
#267
Tragic
73.5%
South Americans
0.4
/100
|
#268
Tragic
73.5%
Colombians
0.3
/100
|
#269
Tragic
73.5%
Immigrants | Russia
0.3
/100
|
#270
Tragic
73.5%
Immigrants | Indonesia
0.3
/100
|
#271
Tragic
73.4%
Belizeans
0.3
/100
|
#272
Tragic
73.4%
Cheyenne
0.2
/100
|
#273
Tragic
73.4%
Immigrants | Colombia
0.2
/100
|
#274
Tragic
73.4%
Immigrants | South America
0.2
/100
|
#275
Tragic
73.3%
Mongolians
0.2
/100
|
#276
Tragic
73.3%
Immigrants | Malaysia
0.2
/100
|
#277
Tragic
73.3%