Immigrants from Turkey vs Celtic In Labor Force | Age 16-19

COMPARE

Immigrants from Turkey
Race
Ancestry
AfghanAfricanAlaska NativeAlaskan AthabascanAlbanianAleutAlsatianAmericanApacheArabArapahoArgentineanArmenianAssyrian/Chaldean/SyriacAustralianAustrianBahamianBangladeshiBarbadianBasqueBelgianBelizeanBermudanBhutaneseBlackfeetBolivianBrazilianBritishBritish West IndianBulgarianBurmeseCajunCambodianCanadianCape VerdeanCarpatho RusynCentral AmericanCentral American IndianCherokeeCheyenneChickasawChileanChineseChippewaChoctawColombianColvilleComancheCosta RicanCreeCreekCroatianCrowCubanCypriotCzechCzechoslovakianDanishDelawareDominicanDutchDutch West IndianEastern EuropeanEcuadorianEgyptianEnglishEstonianEthiopianEuropeanFijianFilipinoFinnishFrenchFrench American IndianFrench CanadianGermanGerman RussianGhanaianGreekGuamanian/ChamorroGuatemalanGuyaneseHaitianHmongHonduranHopiHoumaHungarianIcelanderIndian (Asian)IndonesianInupiatIranianIraqiIrishIroquoisIsraeliItalianJamaicanJapaneseJordanianKenyanKiowaKoreanLaotianLatvianLebaneseLiberianLithuanianLumbeeLuxembourgerMacedonianMalaysianMalteseMarshalleseMenomineeMexicanMexican American IndianMongolianMoroccanNative HawaiianNavajoNepaleseNew ZealanderNicaraguanNigerianNorthern EuropeanNorwegianOkinawanOsageOttawaPaiutePakistaniPalestinianPanamanianParaguayanPennsylvania GermanPeruvianPimaPolishPortuguesePotawatomiPuebloPuerto RicanPuget Sound SalishRomanianRussianSalvadoranSamoanScandinavianScotch-IrishScottishSeminoleSenegaleseSerbianShoshoneSierra LeoneanSiouxSlavicSlovakSloveneSomaliSouth AfricanSouth AmericanSouth American IndianSoviet UnionSpaniardSpanishSpanish AmericanSpanish American IndianSri LankanSubsaharan AfricanSudaneseSwedishSwissSyrianTaiwaneseThaiTlingit-HaidaTohono O'OdhamTonganTrinidadian and TobagonianTsimshianTurkishU.S. Virgin IslanderUgandanUkrainianUruguayanUteVenezuelanVietnameseWelshWest IndianYakamaYaquiYugoslavianYumanYup'ikZimbabwean
Immigration
NonimmigrantsImmigrantsAfghanistanAfricaAlbaniaArgentinaArmeniaAsiaAustraliaAustriaBahamasBangladeshBarbadosBelarusBelgiumBelizeBoliviaBosnia and HerzegovinaBrazilBulgariaBurma/MyanmarCabo VerdeCambodiaCameroonCanadaCaribbeanCentral AmericaChileChinaColombiaCongoCosta RicaCroatiaCubaCzechoslovakiaDenmarkDominicaDominican RepublicEastern AfricaEastern AsiaEastern EuropeEcuadorEgyptEl SalvadorEnglandEritreaEthiopiaEuropeFijiFranceGermanyGhanaGreeceGrenadaGuatemalaGuyanaHaitiHondurasHong KongHungaryIndiaIndonesiaIranIraqIrelandIsraelItalyJamaicaJapanJordanKazakhstanKenyaKoreaKuwaitLaosLatin AmericaLatviaLebanonLiberiaLithuaniaMalaysiaMexicoMicronesiaMiddle AfricaMoldovaMoroccoNepalNetherlandsNicaraguaNigeriaNorth AmericaNorth MacedoniaNorthern AfricaNorthern EuropeNorwayOceaniaPakistanPanamaPeruPhilippinesPolandPortugalRomaniaRussiaSaudi ArabiaScotlandSenegalSerbiaSierra LeoneSingaporeSomaliaSouth AfricaSouth AmericaSouth Central AsiaSouth Eastern AsiaSouthern EuropeSpainSri LankaSt. Vincent and the GrenadinesSudanSwedenSwitzerlandSyriaTaiwanThailandTrinidad and TobagoTurkeyUgandaUkraineUruguayUzbekistanVenezuelaVietnamWest IndiesWestern AfricaWestern AsiaWestern EuropeYemenZaireZimbabweAzores
Celtic
Race
Ancestry
AfghanAfricanAlaska NativeAlaskan AthabascanAlbanianAleutAlsatianAmericanApacheArabArapahoArgentineanArmenianAssyrian/Chaldean/SyriacAustralianAustrianBahamianBangladeshiBarbadianBasqueBelgianBelizeanBermudanBhutaneseBlackfeetBolivianBrazilianBritishBritish West IndianBulgarianBurmeseCajunCambodianCanadianCape VerdeanCarpatho RusynCelticCentral AmericanCentral American IndianCherokeeCheyenneChickasawChileanChineseChippewaChoctawColombianColvilleComancheCosta RicanCreeCreekCroatianCrowCubanCypriotCzechCzechoslovakianDanishDelawareDominicanDutchDutch West IndianEastern EuropeanEcuadorianEgyptianEnglishEstonianEthiopianEuropeanFijianFilipinoFinnishFrenchFrench American IndianFrench CanadianGermanGerman RussianGhanaianGreekGuamanian/ChamorroGuatemalanGuyaneseHaitianHmongHonduranHopiHoumaHungarianIcelanderIndian (Asian)IndonesianInupiatIranianIraqiIrishIroquoisIsraeliItalianJamaicanJapaneseJordanianKenyanKiowaKoreanLaotianLatvianLebaneseLiberianLithuanianLumbeeLuxembourgerMacedonianMalaysianMalteseMarshalleseMenomineeMexicanMexican American IndianMongolianMoroccanNative HawaiianNavajoNepaleseNew ZealanderNicaraguanNigerianNorthern EuropeanNorwegianOkinawanOsageOttawaPaiutePakistaniPalestinianPanamanianParaguayanPennsylvania GermanPeruvianPimaPolishPortuguesePotawatomiPuebloPuerto RicanPuget Sound SalishRomanianRussianSalvadoranSamoanScandinavianScotch-IrishScottishSeminoleSenegaleseSerbianShoshoneSierra LeoneanSiouxSlavicSlovakSloveneSomaliSouth AfricanSouth AmericanSouth American IndianSoviet UnionSpaniardSpanishSpanish AmericanSpanish American IndianSri LankanSubsaharan AfricanSudaneseSwedishSwissSyrianTaiwaneseThaiTlingit-HaidaTohono O'OdhamTonganTrinidadian and TobagonianTsimshianTurkishU.S. Virgin IslanderUgandanUkrainianUruguayanUteVenezuelanVietnameseWelshWest IndianYakamaYaquiYugoslavianYumanYup'ikZimbabwean
Immigration
NonimmigrantsImmigrantsAfghanistanAfricaAlbaniaArgentinaArmeniaAsiaAustraliaAustriaBahamasBangladeshBarbadosBelarusBelgiumBelizeBoliviaBosnia and HerzegovinaBrazilBulgariaBurma/MyanmarCabo VerdeCambodiaCameroonCanadaCaribbeanCentral AmericaChileChinaColombiaCongoCosta RicaCroatiaCubaCzechoslovakiaDenmarkDominicaDominican RepublicEastern AfricaEastern AsiaEastern EuropeEcuadorEgyptEl SalvadorEnglandEritreaEthiopiaEuropeFijiFranceGermanyGhanaGreeceGrenadaGuatemalaGuyanaHaitiHondurasHong KongHungaryIndiaIndonesiaIranIraqIrelandIsraelItalyJamaicaJapanJordanKazakhstanKenyaKoreaKuwaitLaosLatin AmericaLatviaLebanonLiberiaLithuaniaMalaysiaMexicoMicronesiaMiddle AfricaMoldovaMoroccoNepalNetherlandsNicaraguaNigeriaNorth AmericaNorth MacedoniaNorthern AfricaNorthern EuropeNorwayOceaniaPakistanPanamaPeruPhilippinesPolandPortugalRomaniaRussiaSaudi ArabiaScotlandSenegalSerbiaSierra LeoneSingaporeSomaliaSouth AfricaSouth AmericaSouth Central AsiaSouth Eastern AsiaSouthern EuropeSpainSri LankaSt. Vincent and the GrenadinesSudanSwedenSwitzerlandSyriaTaiwanThailandTrinidad and TobagoUgandaUkraineUruguayUzbekistanVenezuelaVietnamWest IndiesWestern AfricaWestern AsiaWestern EuropeYemenZaireZimbabweAzores
In Labor Force | Age 16-19
Income
Poverty
Unemployment
Labor Participation
Family Structure
Vehicle Availability
Education Level
Disability

In Labor Force | Age 16-19 Comparison

Immigrants from Turkey

Celtics

Tragic
Exceptional
34.9%
IN LABOR FORCE | AGE 16-19
2.6/ 100
METRIC RATING
244th/ 347
METRIC RANK
41.3%
IN LABOR FORCE | AGE 16-19
100.0/ 100
METRIC RATING
41st/ 347
METRIC RANK

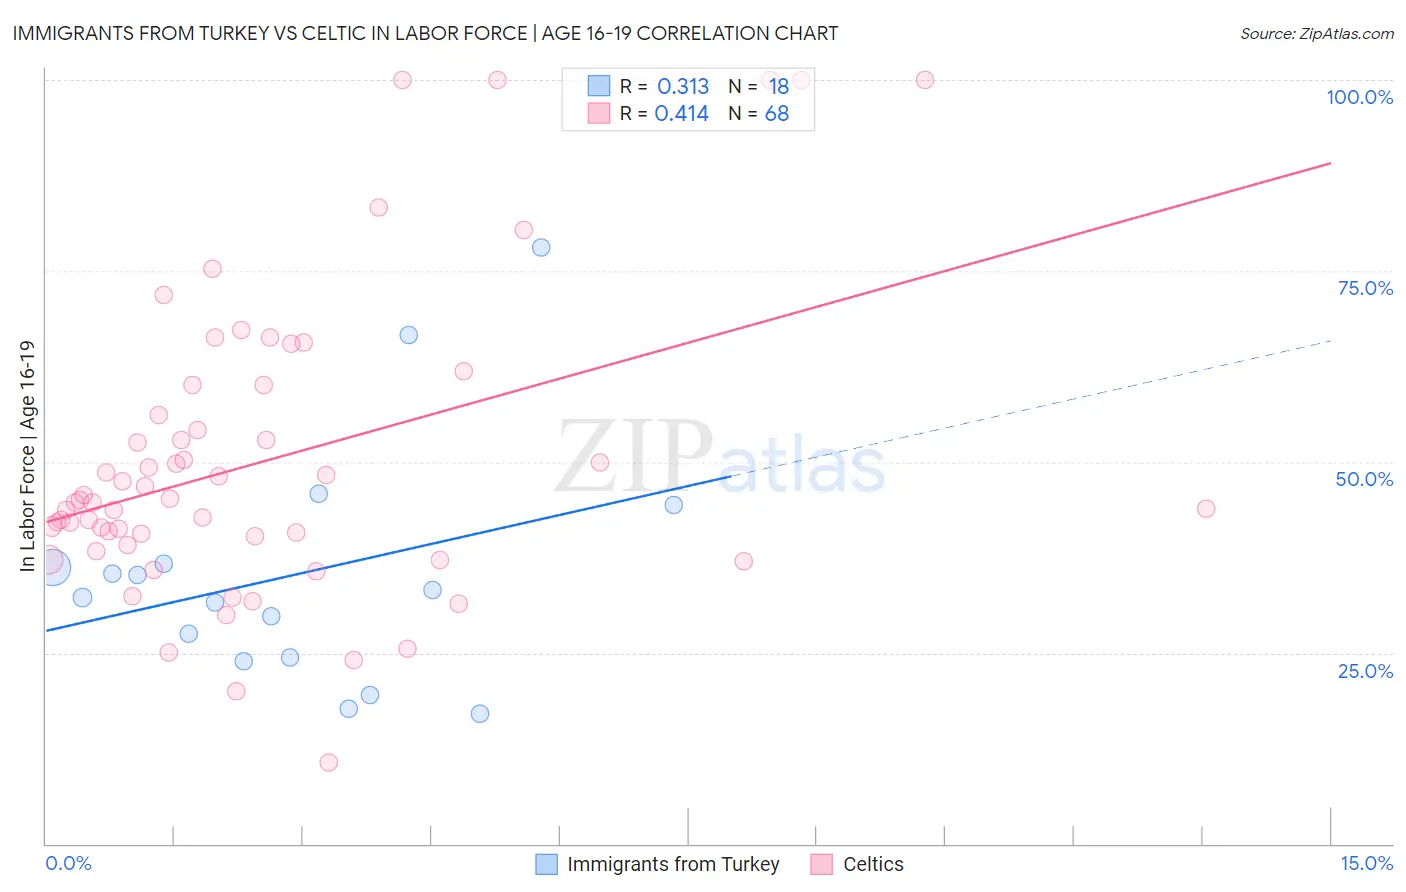
Immigrants from Turkey vs Celtic In Labor Force | Age 16-19 Correlation Chart

The statistical analysis conducted on geographies consisting of 222,808,071 people shows a mild positive correlation between the proportion of Immigrants from Turkey and labor force participation rate among population between the ages 16 and 19 in the United States with a correlation coefficient (R) of 0.313 and weighted average of 34.9%. Similarly, the statistical analysis conducted on geographies consisting of 168,748,134 people shows a moderate positive correlation between the proportion of Celtics and labor force participation rate among population between the ages 16 and 19 in the United States with a correlation coefficient (R) of 0.414 and weighted average of 41.3%, a difference of 18.4%.
Immigrants from Turkey vs Celtic In Labor Force | Age 16-19

In Labor Force | Age 16-19 Correlation Summary

MeasurementImmigrants from TurkeyCeltic
Minimum17.1%10.6%
Maximum78.1%100.0%
Range61.0%89.4%
Mean35.3%50.1%
Median32.8%44.9%
Interquartile 25% (IQ1)24.3%39.6%
Interquartile 75% (IQ3)36.6%58.1%
Interquartile Range (IQR)12.3%18.5%
Standard Deviation (Sample)15.8%19.6%
Standard Deviation (Population)15.4%19.4%

Similar Demographics by In Labor Force | Age 16-19

Demographics Similar to Immigrants from Turkey by In Labor Force | Age 16-19

In terms of in labor force | age 16-19, the demographic groups most similar to Immigrants from Turkey are Pueblo (34.9%, a difference of 0.020%), Uruguayan (34.9%, a difference of 0.050%), Immigrants from Greece (34.9%, a difference of 0.060%), Immigrants from Sri Lanka (34.9%, a difference of 0.080%), and Laotian (34.9%, a difference of 0.090%).
DemographicsRating | RankIn Labor Force | Age 16-19
Immigrants | India
3.5
/100
|
#237
Tragic
35.0%
Immigrants | Vietnam
3.4
/100
|
#238
Tragic
35.0%
Inupiat
3.2
/100
|
#239
Tragic
35.0%
Immigrants | Central America
3.0
/100
|
#240
Tragic
35.0%
Immigrants | Ireland
2.9
/100
|
#241
Tragic
35.0%
Uruguayans
2.6
/100
|
#242
Tragic
34.9%
Pueblo
2.6
/100
|
#243
Tragic
34.9%
Immigrants | Turkey
2.6
/100
|
#244
Tragic
34.9%
Immigrants | Greece
2.4
/100
|
#245
Tragic
34.9%
Immigrants | Sri Lanka
2.4
/100
|
#246
Tragic
34.9%
Laotians
2.4
/100
|
#247
Tragic
34.9%
Central Americans
2.2
/100
|
#248
Tragic
34.8%
Immigrants | Ukraine
2.2
/100
|
#249
Tragic
34.8%
Immigrants | Pakistan
2.0
/100
|
#250
Tragic
34.8%
Immigrants | Western Asia
2.0
/100
|
#251
Tragic
34.8%

Demographics Similar to Celtics by In Labor Force | Age 16-19

In terms of in labor force | age 16-19, the demographic groups most similar to Celtics are White/Caucasian (41.3%, a difference of 0.010%), Tongan (41.2%, a difference of 0.31%), Immigrants from Liberia (41.5%, a difference of 0.34%), European (41.1%, a difference of 0.42%), and Scotch-Irish (41.5%, a difference of 0.44%).
DemographicsRating | RankIn Labor Force | Age 16-19
Immigrants | Bosnia and Herzegovina
100.0
/100
|
#34
Exceptional
41.8%
Yugoslavians
100.0
/100
|
#35
Exceptional
41.8%
Immigrants | Azores
100.0
/100
|
#36
Exceptional
41.7%
Immigrants | Congo
100.0
/100
|
#37
Exceptional
41.7%
Sioux
100.0
/100
|
#38
Exceptional
41.5%
Scotch-Irish
100.0
/100
|
#39
Exceptional
41.5%
Immigrants | Liberia
100.0
/100
|
#40
Exceptional
41.5%
Celtics
100.0
/100
|
#41
Exceptional
41.3%
Whites/Caucasians
100.0
/100
|
#42
Exceptional
41.3%
Tongans
100.0
/100
|
#43
Exceptional
41.2%
Europeans
100.0
/100
|
#44
Exceptional
41.1%
Croatians
100.0
/100
|
#45
Exceptional
41.1%
Immigrants | Sudan
100.0
/100
|
#46
Exceptional
41.0%
Carpatho Rusyns
100.0
/100
|
#47
Exceptional
40.8%
Icelanders
100.0
/100
|
#48
Exceptional
40.8%