Immigrants from Taiwan vs Cherokee In Labor Force | Age 20-24

COMPARE

Immigrants from Taiwan
Race
Ancestry
AfghanAfricanAlaska NativeAlaskan AthabascanAlbanianAleutAlsatianAmericanApacheArabArapahoArgentineanArmenianAssyrian/Chaldean/SyriacAustralianAustrianBahamianBangladeshiBarbadianBasqueBelgianBelizeanBermudanBhutaneseBlackfeetBolivianBrazilianBritishBritish West IndianBulgarianBurmeseCajunCambodianCanadianCape VerdeanCarpatho RusynCelticCentral AmericanCentral American IndianCheyenneChickasawChileanChineseChippewaChoctawColombianColvilleComancheCosta RicanCreeCreekCroatianCrowCubanCypriotCzechCzechoslovakianDanishDelawareDominicanDutchDutch West IndianEastern EuropeanEcuadorianEgyptianEnglishEstonianEthiopianEuropeanFijianFilipinoFinnishFrenchFrench American IndianFrench CanadianGermanGerman RussianGhanaianGreekGuamanian/ChamorroGuatemalanGuyaneseHaitianHmongHonduranHopiHoumaHungarianIcelanderIndian (Asian)IndonesianInupiatIranianIraqiIrishIroquoisIsraeliItalianJamaicanJapaneseJordanianKenyanKiowaKoreanLaotianLatvianLebaneseLiberianLithuanianLumbeeLuxembourgerMacedonianMalaysianMalteseMarshalleseMenomineeMexicanMexican American IndianMongolianMoroccanNative HawaiianNavajoNepaleseNew ZealanderNicaraguanNigerianNorthern EuropeanNorwegianOkinawanOsageOttawaPaiutePakistaniPalestinianPanamanianParaguayanPennsylvania GermanPeruvianPimaPolishPortuguesePotawatomiPuebloPuerto RicanPuget Sound SalishRomanianRussianSalvadoranSamoanScandinavianScotch-IrishScottishSeminoleSenegaleseSerbianShoshoneSierra LeoneanSiouxSlavicSlovakSloveneSomaliSouth AfricanSouth AmericanSouth American IndianSoviet UnionSpaniardSpanishSpanish AmericanSpanish American IndianSri LankanSubsaharan AfricanSudaneseSwedishSwissSyrianTaiwaneseThaiTlingit-HaidaTohono O'OdhamTonganTrinidadian and TobagonianTsimshianTurkishU.S. Virgin IslanderUgandanUkrainianUruguayanUteVenezuelanVietnameseWelshWest IndianYakamaYaquiYugoslavianYumanYup'ikZimbabwean
Immigration
NonimmigrantsImmigrantsAfghanistanAfricaAlbaniaArgentinaArmeniaAsiaAustraliaAustriaBahamasBangladeshBarbadosBelarusBelgiumBelizeBoliviaBosnia and HerzegovinaBrazilBulgariaBurma/MyanmarCabo VerdeCambodiaCameroonCanadaCaribbeanCentral AmericaChileChinaColombiaCongoCosta RicaCroatiaCubaCzechoslovakiaDenmarkDominicaDominican RepublicEastern AfricaEastern AsiaEastern EuropeEcuadorEgyptEl SalvadorEnglandEritreaEthiopiaEuropeFijiFranceGermanyGhanaGreeceGrenadaGuatemalaGuyanaHaitiHondurasHong KongHungaryIndiaIndonesiaIranIraqIrelandIsraelItalyJamaicaJapanJordanKazakhstanKenyaKoreaKuwaitLaosLatin AmericaLatviaLebanonLiberiaLithuaniaMalaysiaMexicoMicronesiaMiddle AfricaMoldovaMoroccoNepalNetherlandsNicaraguaNigeriaNorth AmericaNorth MacedoniaNorthern AfricaNorthern EuropeNorwayOceaniaPakistanPanamaPeruPhilippinesPolandPortugalRomaniaRussiaSaudi ArabiaScotlandSenegalSerbiaSierra LeoneSingaporeSomaliaSouth AfricaSouth AmericaSouth Central AsiaSouth Eastern AsiaSouthern EuropeSpainSri LankaSt. Vincent and the GrenadinesSudanSwedenSwitzerlandSyriaTaiwanThailandTrinidad and TobagoTurkeyUgandaUkraineUruguayUzbekistanVenezuelaVietnamWest IndiesWestern AfricaWestern AsiaWestern EuropeYemenZaireZimbabweAzores
Cherokee
Race
Ancestry
AfghanAfricanAlaska NativeAlaskan AthabascanAlbanianAleutAlsatianAmericanApacheArabArapahoArgentineanArmenianAssyrian/Chaldean/SyriacAustralianAustrianBahamianBangladeshiBarbadianBasqueBelgianBelizeanBermudanBhutaneseBlackfeetBolivianBrazilianBritishBritish West IndianBulgarianBurmeseCajunCambodianCanadianCape VerdeanCarpatho RusynCelticCentral AmericanCentral American IndianCherokeeCheyenneChickasawChileanChineseChippewaChoctawColombianColvilleComancheCosta RicanCreeCreekCroatianCrowCubanCypriotCzechCzechoslovakianDanishDelawareDominicanDutchDutch West IndianEastern EuropeanEcuadorianEgyptianEnglishEstonianEthiopianEuropeanFijianFilipinoFinnishFrenchFrench American IndianFrench CanadianGermanGerman RussianGhanaianGreekGuamanian/ChamorroGuatemalanGuyaneseHaitianHmongHonduranHopiHoumaHungarianIcelanderIndian (Asian)IndonesianInupiatIranianIraqiIrishIroquoisIsraeliItalianJamaicanJapaneseJordanianKenyanKiowaKoreanLaotianLatvianLebaneseLiberianLithuanianLumbeeLuxembourgerMacedonianMalaysianMalteseMarshalleseMenomineeMexicanMexican American IndianMongolianMoroccanNative HawaiianNavajoNepaleseNew ZealanderNicaraguanNigerianNorthern EuropeanNorwegianOkinawanOsageOttawaPaiutePakistaniPalestinianPanamanianParaguayanPennsylvania GermanPeruvianPimaPolishPortuguesePotawatomiPuebloPuerto RicanPuget Sound SalishRomanianRussianSalvadoranSamoanScandinavianScotch-IrishScottishSeminoleSenegaleseSerbianShoshoneSierra LeoneanSiouxSlavicSlovakSloveneSomaliSouth AfricanSouth AmericanSouth American IndianSoviet UnionSpaniardSpanishSpanish AmericanSpanish American IndianSri LankanSubsaharan AfricanSudaneseSwedishSwissSyrianTaiwaneseThaiTlingit-HaidaTohono O'OdhamTonganTrinidadian and TobagonianTsimshianTurkishU.S. Virgin IslanderUgandanUkrainianUruguayanUteVenezuelanVietnameseWelshWest IndianYakamaYaquiYugoslavianYumanYup'ikZimbabwean
Immigration
NonimmigrantsImmigrantsAfghanistanAfricaAlbaniaArgentinaArmeniaAsiaAustraliaAustriaBahamasBangladeshBarbadosBelarusBelgiumBelizeBoliviaBosnia and HerzegovinaBrazilBulgariaBurma/MyanmarCabo VerdeCambodiaCameroonCanadaCaribbeanCentral AmericaChileChinaColombiaCongoCosta RicaCroatiaCubaCzechoslovakiaDenmarkDominicaDominican RepublicEastern AfricaEastern AsiaEastern EuropeEcuadorEgyptEl SalvadorEnglandEritreaEthiopiaEuropeFijiFranceGermanyGhanaGreeceGrenadaGuatemalaGuyanaHaitiHondurasHong KongHungaryIndiaIndonesiaIranIraqIrelandIsraelItalyJamaicaJapanJordanKazakhstanKenyaKoreaKuwaitLaosLatin AmericaLatviaLebanonLiberiaLithuaniaMalaysiaMexicoMicronesiaMiddle AfricaMoldovaMoroccoNepalNetherlandsNicaraguaNigeriaNorth AmericaNorth MacedoniaNorthern AfricaNorthern EuropeNorwayOceaniaPakistanPanamaPeruPhilippinesPolandPortugalRomaniaRussiaSaudi ArabiaScotlandSenegalSerbiaSierra LeoneSingaporeSomaliaSouth AfricaSouth AmericaSouth Central AsiaSouth Eastern AsiaSouthern EuropeSpainSri LankaSt. Vincent and the GrenadinesSudanSwedenSwitzerlandSyriaThailandTrinidad and TobagoTurkeyUgandaUkraineUruguayUzbekistanVenezuelaVietnamWest IndiesWestern AfricaWestern AsiaWestern EuropeYemenZaireZimbabweAzores
In Labor Force | Age 20-24
Income
Poverty
Unemployment
Labor Participation
Family Structure
Vehicle Availability
Education Level
Disability

In Labor Force | Age 20-24 Comparison

Immigrants from Taiwan

Cherokee

Tragic
Exceptional
71.5%
IN LABOR FORCE | AGE 20-24
0.0/ 100
METRIC RATING
321st/ 347
METRIC RANK
75.9%
IN LABOR FORCE | AGE 20-24
95.8/ 100
METRIC RATING
109th/ 347
METRIC RANK

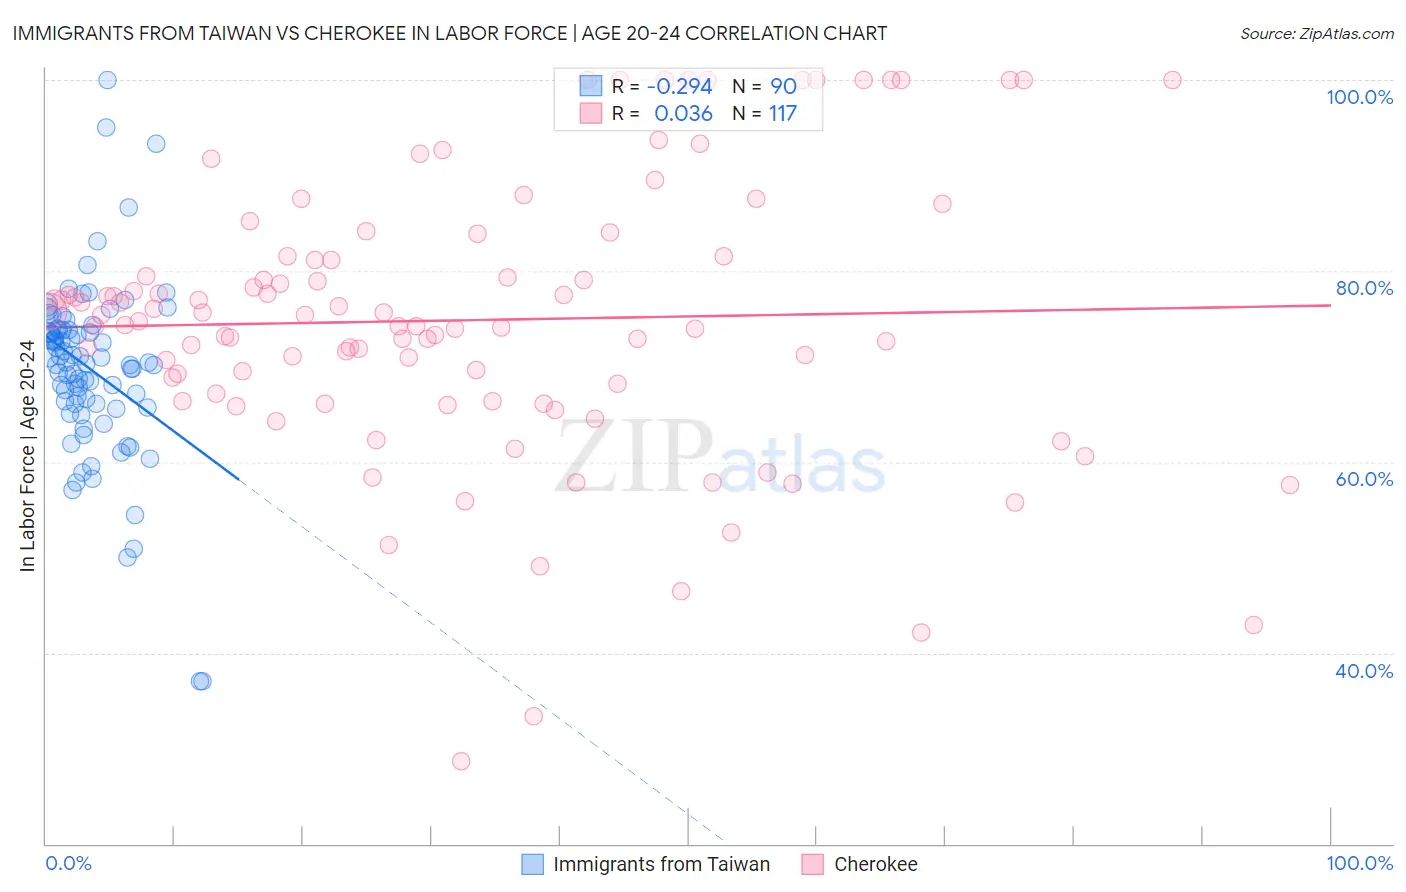
Immigrants from Taiwan vs Cherokee In Labor Force | Age 20-24 Correlation Chart

The statistical analysis conducted on geographies consisting of 298,185,323 people shows a weak negative correlation between the proportion of Immigrants from Taiwan and labor force participation rate among population between the ages 20 and 24 in the United States with a correlation coefficient (R) of -0.294 and weighted average of 71.5%. Similarly, the statistical analysis conducted on geographies consisting of 493,178,000 people shows no correlation between the proportion of Cherokee and labor force participation rate among population between the ages 20 and 24 in the United States with a correlation coefficient (R) of 0.036 and weighted average of 75.9%, a difference of 6.2%.
Immigrants from Taiwan vs Cherokee In Labor Force | Age 20-24

In Labor Force | Age 20-24 Correlation Summary

MeasurementImmigrants from TaiwanCherokee
Minimum37.0%28.6%
Maximum100.0%100.0%
Range63.0%71.4%
Mean69.7%74.8%
Median70.3%74.7%
Interquartile 25% (IQ1)66.1%66.8%
Interquartile 75% (IQ3)73.8%81.3%
Interquartile Range (IQR)7.7%14.6%
Standard Deviation (Sample)9.4%14.4%
Standard Deviation (Population)9.4%14.4%

Similar Demographics by In Labor Force | Age 20-24

Demographics Similar to Immigrants from Taiwan by In Labor Force | Age 20-24

In terms of in labor force | age 20-24, the demographic groups most similar to Immigrants from Taiwan are Trinidadian and Tobagonian (71.5%, a difference of 0.050%), Immigrants from Israel (71.6%, a difference of 0.13%), Filipino (71.4%, a difference of 0.13%), Immigrants from Hong Kong (71.6%, a difference of 0.16%), and Immigrants from Armenia (71.7%, a difference of 0.25%).
DemographicsRating | RankIn Labor Force | Age 20-24
Indians (Asian)
0.0
/100
|
#314
Tragic
71.9%
Immigrants | Iran
0.0
/100
|
#315
Tragic
71.8%
Immigrants | Eastern Asia
0.0
/100
|
#316
Tragic
71.8%
Immigrants | Armenia
0.0
/100
|
#317
Tragic
71.7%
Immigrants | Hong Kong
0.0
/100
|
#318
Tragic
71.6%
Immigrants | Israel
0.0
/100
|
#319
Tragic
71.6%
Trinidadians and Tobagonians
0.0
/100
|
#320
Tragic
71.5%
Immigrants | Taiwan
0.0
/100
|
#321
Tragic
71.5%
Filipinos
0.0
/100
|
#322
Tragic
71.4%
West Indians
0.0
/100
|
#323
Tragic
71.3%
Immigrants | Dominican Republic
0.0
/100
|
#324
Tragic
71.2%
Barbadians
0.0
/100
|
#325
Tragic
71.1%
Dominicans
0.0
/100
|
#326
Tragic
71.1%
Immigrants | Trinidad and Tobago
0.0
/100
|
#327
Tragic
71.1%
Immigrants | China
0.0
/100
|
#328
Tragic
71.1%

Demographics Similar to Cherokee by In Labor Force | Age 20-24

In terms of in labor force | age 20-24, the demographic groups most similar to Cherokee are Immigrants from Morocco (75.9%, a difference of 0.0%), Ukrainian (75.9%, a difference of 0.010%), Immigrants from Canada (75.9%, a difference of 0.020%), Immigrants from Netherlands (75.9%, a difference of 0.050%), and Immigrants from Zimbabwe (75.9%, a difference of 0.060%).
DemographicsRating | RankIn Labor Force | Age 20-24
Latvians
97.6
/100
|
#102
Exceptional
76.1%
Immigrants | North Macedonia
97.5
/100
|
#103
Exceptional
76.1%
Macedonians
97.2
/100
|
#104
Exceptional
76.0%
Immigrants | Nepal
97.2
/100
|
#105
Exceptional
76.0%
Immigrants | Uganda
97.1
/100
|
#106
Exceptional
76.0%
Greeks
96.9
/100
|
#107
Exceptional
76.0%
Iraqis
96.6
/100
|
#108
Exceptional
76.0%
Cherokee
95.8
/100
|
#109
Exceptional
75.9%
Immigrants | Morocco
95.8
/100
|
#110
Exceptional
75.9%
Ukrainians
95.7
/100
|
#111
Exceptional
75.9%
Immigrants | Canada
95.6
/100
|
#112
Exceptional
75.9%
Immigrants | Netherlands
95.3
/100
|
#113
Exceptional
75.9%
Immigrants | Zimbabwe
95.1
/100
|
#114
Exceptional
75.9%
Alaska Natives
95.1
/100
|
#115
Exceptional
75.9%
Immigrants | North America
95.0
/100
|
#116
Exceptional
75.9%