Immigrants from Sri Lanka vs Iroquois In Labor Force | Age 20-24

COMPARE

Immigrants from Sri Lanka
Race
Ancestry
AfghanAfricanAlaska NativeAlaskan AthabascanAlbanianAleutAlsatianAmericanApacheArabArapahoArgentineanArmenianAssyrian/Chaldean/SyriacAustralianAustrianBahamianBangladeshiBarbadianBasqueBelgianBelizeanBermudanBhutaneseBlackfeetBolivianBrazilianBritishBritish West IndianBulgarianBurmeseCajunCambodianCanadianCape VerdeanCarpatho RusynCelticCentral AmericanCentral American IndianCherokeeCheyenneChickasawChileanChineseChippewaChoctawColombianColvilleComancheCosta RicanCreeCreekCroatianCrowCubanCypriotCzechCzechoslovakianDanishDelawareDominicanDutchDutch West IndianEastern EuropeanEcuadorianEgyptianEnglishEstonianEthiopianEuropeanFijianFilipinoFinnishFrenchFrench American IndianFrench CanadianGermanGerman RussianGhanaianGreekGuamanian/ChamorroGuatemalanGuyaneseHaitianHmongHonduranHopiHoumaHungarianIcelanderIndian (Asian)IndonesianInupiatIranianIraqiIrishIsraeliItalianJamaicanJapaneseJordanianKenyanKiowaKoreanLaotianLatvianLebaneseLiberianLithuanianLumbeeLuxembourgerMacedonianMalaysianMalteseMarshalleseMenomineeMexicanMexican American IndianMongolianMoroccanNative HawaiianNavajoNepaleseNew ZealanderNicaraguanNigerianNorthern EuropeanNorwegianOkinawanOsageOttawaPaiutePakistaniPalestinianPanamanianParaguayanPennsylvania GermanPeruvianPimaPolishPortuguesePotawatomiPuebloPuerto RicanPuget Sound SalishRomanianRussianSalvadoranSamoanScandinavianScotch-IrishScottishSeminoleSenegaleseSerbianShoshoneSierra LeoneanSiouxSlavicSlovakSloveneSomaliSouth AfricanSouth AmericanSouth American IndianSoviet UnionSpaniardSpanishSpanish AmericanSpanish American IndianSri LankanSubsaharan AfricanSudaneseSwedishSwissSyrianTaiwaneseThaiTlingit-HaidaTohono O'OdhamTonganTrinidadian and TobagonianTsimshianTurkishU.S. Virgin IslanderUgandanUkrainianUruguayanUteVenezuelanVietnameseWelshWest IndianYakamaYaquiYugoslavianYumanYup'ikZimbabwean
Immigration
NonimmigrantsImmigrantsAfghanistanAfricaAlbaniaArgentinaArmeniaAsiaAustraliaAustriaBahamasBangladeshBarbadosBelarusBelgiumBelizeBoliviaBosnia and HerzegovinaBrazilBulgariaBurma/MyanmarCabo VerdeCambodiaCameroonCanadaCaribbeanCentral AmericaChileChinaColombiaCongoCosta RicaCroatiaCubaCzechoslovakiaDenmarkDominicaDominican RepublicEastern AfricaEastern AsiaEastern EuropeEcuadorEgyptEl SalvadorEnglandEritreaEthiopiaEuropeFijiFranceGermanyGhanaGreeceGrenadaGuatemalaGuyanaHaitiHondurasHong KongHungaryIndiaIndonesiaIranIraqIrelandIsraelItalyJamaicaJapanJordanKazakhstanKenyaKoreaKuwaitLaosLatin AmericaLatviaLebanonLiberiaLithuaniaMalaysiaMexicoMicronesiaMiddle AfricaMoldovaMoroccoNepalNetherlandsNicaraguaNigeriaNorth AmericaNorth MacedoniaNorthern AfricaNorthern EuropeNorwayOceaniaPakistanPanamaPeruPhilippinesPolandPortugalRomaniaRussiaSaudi ArabiaScotlandSenegalSerbiaSierra LeoneSingaporeSomaliaSouth AfricaSouth AmericaSouth Central AsiaSouth Eastern AsiaSouthern EuropeSpainSri LankaSt. Vincent and the GrenadinesSudanSwedenSwitzerlandSyriaTaiwanThailandTrinidad and TobagoTurkeyUgandaUkraineUruguayUzbekistanVenezuelaVietnamWest IndiesWestern AfricaWestern AsiaWestern EuropeYemenZaireZimbabweAzores
Iroquois
Race
Ancestry
AfghanAfricanAlaska NativeAlaskan AthabascanAlbanianAleutAlsatianAmericanApacheArabArapahoArgentineanArmenianAssyrian/Chaldean/SyriacAustralianAustrianBahamianBangladeshiBarbadianBasqueBelgianBelizeanBermudanBhutaneseBlackfeetBolivianBrazilianBritishBritish West IndianBulgarianBurmeseCajunCambodianCanadianCape VerdeanCarpatho RusynCelticCentral AmericanCentral American IndianCherokeeCheyenneChickasawChileanChineseChippewaChoctawColombianColvilleComancheCosta RicanCreeCreekCroatianCrowCubanCypriotCzechCzechoslovakianDanishDelawareDominicanDutchDutch West IndianEastern EuropeanEcuadorianEgyptianEnglishEstonianEthiopianEuropeanFijianFilipinoFinnishFrenchFrench American IndianFrench CanadianGermanGerman RussianGhanaianGreekGuamanian/ChamorroGuatemalanGuyaneseHaitianHmongHonduranHopiHoumaHungarianIcelanderIndian (Asian)IndonesianInupiatIranianIraqiIrishIroquoisIsraeliItalianJamaicanJapaneseJordanianKenyanKiowaKoreanLaotianLatvianLebaneseLiberianLithuanianLumbeeLuxembourgerMacedonianMalaysianMalteseMarshalleseMenomineeMexicanMexican American IndianMongolianMoroccanNative HawaiianNavajoNepaleseNew ZealanderNicaraguanNigerianNorthern EuropeanNorwegianOkinawanOsageOttawaPaiutePakistaniPalestinianPanamanianParaguayanPennsylvania GermanPeruvianPimaPolishPortuguesePotawatomiPuebloPuerto RicanPuget Sound SalishRomanianRussianSalvadoranSamoanScandinavianScotch-IrishScottishSeminoleSenegaleseSerbianShoshoneSierra LeoneanSiouxSlavicSlovakSloveneSomaliSouth AfricanSouth AmericanSouth American IndianSoviet UnionSpaniardSpanishSpanish AmericanSpanish American IndianSri LankanSubsaharan AfricanSudaneseSwedishSwissSyrianTaiwaneseThaiTlingit-HaidaTohono O'OdhamTonganTrinidadian and TobagonianTsimshianTurkishU.S. Virgin IslanderUgandanUkrainianUruguayanUteVenezuelanVietnameseWelshWest IndianYakamaYaquiYugoslavianYumanYup'ikZimbabwean
Immigration
NonimmigrantsImmigrantsAfghanistanAfricaAlbaniaArgentinaArmeniaAsiaAustraliaAustriaBahamasBangladeshBarbadosBelarusBelgiumBelizeBoliviaBosnia and HerzegovinaBrazilBulgariaBurma/MyanmarCabo VerdeCambodiaCameroonCanadaCaribbeanCentral AmericaChileChinaColombiaCongoCosta RicaCroatiaCubaCzechoslovakiaDenmarkDominicaDominican RepublicEastern AfricaEastern AsiaEastern EuropeEcuadorEgyptEl SalvadorEnglandEritreaEthiopiaEuropeFijiFranceGermanyGhanaGreeceGrenadaGuatemalaGuyanaHaitiHondurasHong KongHungaryIndiaIndonesiaIranIraqIrelandIsraelItalyJamaicaJapanJordanKazakhstanKenyaKoreaKuwaitLaosLatin AmericaLatviaLebanonLiberiaLithuaniaMalaysiaMexicoMicronesiaMiddle AfricaMoldovaMoroccoNepalNetherlandsNicaraguaNigeriaNorth AmericaNorth MacedoniaNorthern AfricaNorthern EuropeNorwayOceaniaPakistanPanamaPeruPhilippinesPolandPortugalRomaniaRussiaSaudi ArabiaScotlandSenegalSerbiaSierra LeoneSingaporeSomaliaSouth AfricaSouth AmericaSouth Central AsiaSouth Eastern AsiaSouthern EuropeSpainSt. Vincent and the GrenadinesSudanSwedenSwitzerlandSyriaTaiwanThailandTrinidad and TobagoTurkeyUgandaUkraineUruguayUzbekistanVenezuelaVietnamWest IndiesWestern AfricaWestern AsiaWestern EuropeYemenZaireZimbabweAzores
In Labor Force | Age 20-24
Income
Poverty
Unemployment
Labor Participation
Family Structure
Vehicle Availability
Education Level
Disability

In Labor Force | Age 20-24 Comparison

Immigrants from Sri Lanka

Iroquois

Tragic
Excellent
74.0%
IN LABOR FORCE | AGE 20-24
2.3/ 100
METRIC RATING
240th/ 347
METRIC RANK
75.6%
IN LABOR FORCE | AGE 20-24
89.1/ 100
METRIC RATING
129th/ 347
METRIC RANK

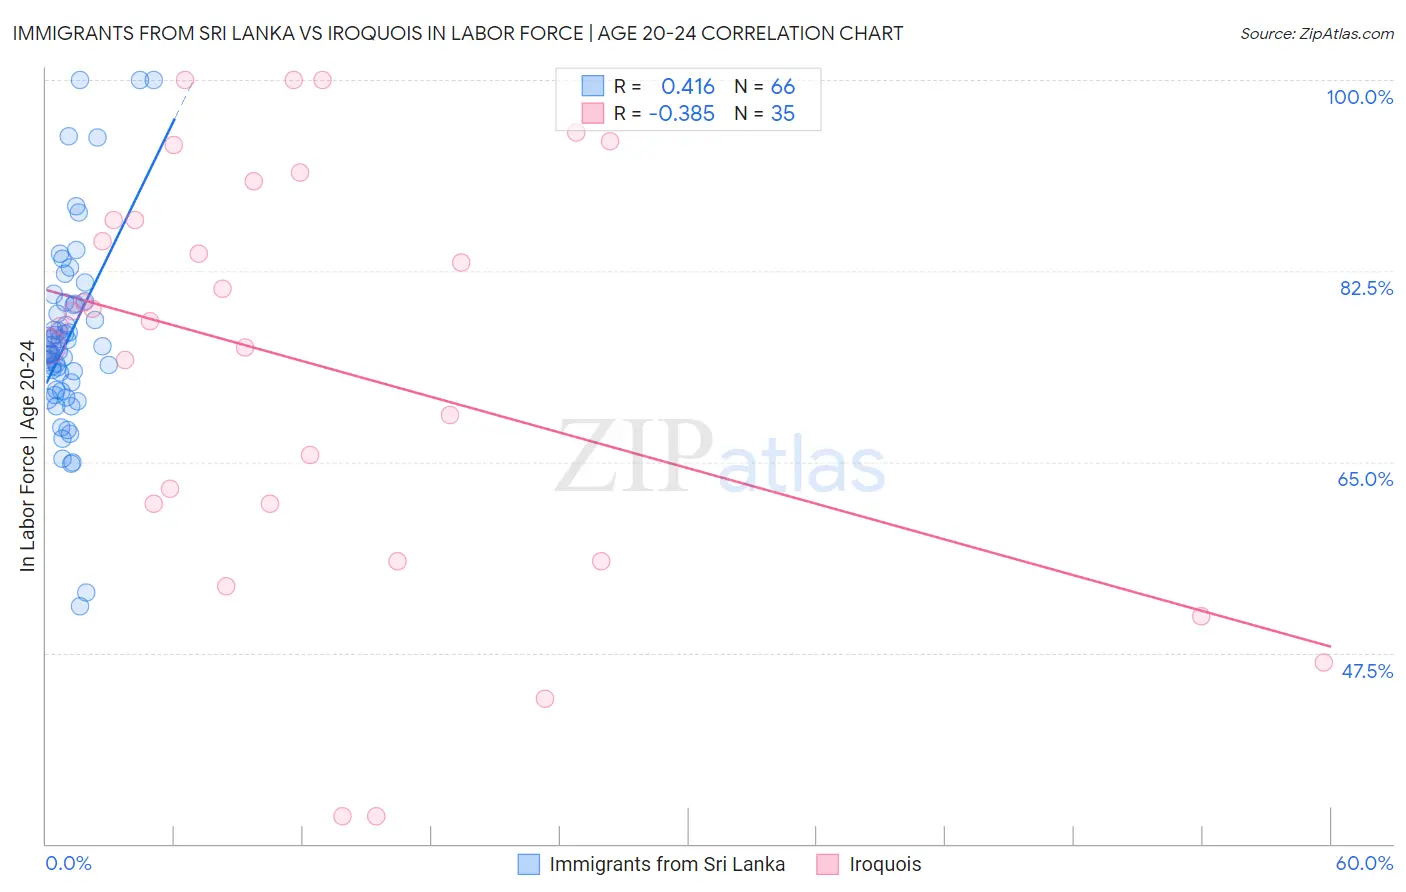
Immigrants from Sri Lanka vs Iroquois In Labor Force | Age 20-24 Correlation Chart

The statistical analysis conducted on geographies consisting of 149,693,440 people shows a moderate positive correlation between the proportion of Immigrants from Sri Lanka and labor force participation rate among population between the ages 20 and 24 in the United States with a correlation coefficient (R) of 0.416 and weighted average of 74.0%. Similarly, the statistical analysis conducted on geographies consisting of 207,263,763 people shows a mild negative correlation between the proportion of Iroquois and labor force participation rate among population between the ages 20 and 24 in the United States with a correlation coefficient (R) of -0.385 and weighted average of 75.6%, a difference of 2.2%.
Immigrants from Sri Lanka vs Iroquois In Labor Force | Age 20-24

In Labor Force | Age 20-24 Correlation Summary

MeasurementImmigrants from Sri LankaIroquois
Minimum51.8%32.5%
Maximum100.0%100.0%
Range48.2%67.5%
Mean76.3%73.8%
Median75.1%77.9%
Interquartile 25% (IQ1)71.6%61.2%
Interquartile 75% (IQ3)79.5%87.2%
Interquartile Range (IQR)7.8%26.0%
Standard Deviation (Sample)8.9%18.8%
Standard Deviation (Population)8.8%18.5%

Similar Demographics by In Labor Force | Age 20-24

Demographics Similar to Immigrants from Sri Lanka by In Labor Force | Age 20-24

In terms of in labor force | age 20-24, the demographic groups most similar to Immigrants from Sri Lanka are Immigrants from Senegal (74.0%, a difference of 0.030%), Thai (74.0%, a difference of 0.040%), Immigrants from Latin America (74.1%, a difference of 0.060%), Immigrants from Syria (74.0%, a difference of 0.070%), and Immigrants from South Central Asia (74.0%, a difference of 0.070%).
DemographicsRating | RankIn Labor Force | Age 20-24
Immigrants | Chile
3.7
/100
|
#233
Tragic
74.1%
Immigrants | Immigrants
3.6
/100
|
#234
Tragic
74.1%
Laotians
3.5
/100
|
#235
Tragic
74.1%
Immigrants | France
3.3
/100
|
#236
Tragic
74.1%
Bermudans
3.2
/100
|
#237
Tragic
74.1%
Immigrants | Japan
3.0
/100
|
#238
Tragic
74.1%
Immigrants | Latin America
2.7
/100
|
#239
Tragic
74.1%
Immigrants | Sri Lanka
2.3
/100
|
#240
Tragic
74.0%
Immigrants | Senegal
2.1
/100
|
#241
Tragic
74.0%
Thais
2.1
/100
|
#242
Tragic
74.0%
Immigrants | Syria
1.9
/100
|
#243
Tragic
74.0%
Immigrants | South Central Asia
1.9
/100
|
#244
Tragic
74.0%
Turks
1.8
/100
|
#245
Tragic
73.9%
Immigrants | Panama
1.6
/100
|
#246
Tragic
73.9%
Colville
1.5
/100
|
#247
Tragic
73.9%

Demographics Similar to Iroquois by In Labor Force | Age 20-24

In terms of in labor force | age 20-24, the demographic groups most similar to Iroquois are Immigrants from Afghanistan (75.6%, a difference of 0.010%), Immigrants from Austria (75.6%, a difference of 0.010%), Immigrants from Jordan (75.6%, a difference of 0.020%), Palestinian (75.6%, a difference of 0.020%), and Zimbabwean (75.6%, a difference of 0.030%).
DemographicsRating | RankIn Labor Force | Age 20-24
Pakistanis
94.1
/100
|
#122
Exceptional
75.8%
Immigrants | Bulgaria
94.1
/100
|
#123
Exceptional
75.8%
Immigrants | Sierra Leone
93.8
/100
|
#124
Exceptional
75.8%
Immigrants | Scotland
93.7
/100
|
#125
Exceptional
75.8%
Brazilians
93.0
/100
|
#126
Exceptional
75.8%
Sub-Saharan Africans
90.9
/100
|
#127
Exceptional
75.7%
Immigrants | Afghanistan
89.4
/100
|
#128
Excellent
75.6%
Iroquois
89.1
/100
|
#129
Excellent
75.6%
Immigrants | Austria
88.8
/100
|
#130
Excellent
75.6%
Immigrants | Jordan
88.5
/100
|
#131
Excellent
75.6%
Palestinians
88.4
/100
|
#132
Excellent
75.6%
Zimbabweans
88.2
/100
|
#133
Excellent
75.6%
Estonians
87.1
/100
|
#134
Excellent
75.6%
Yaqui
85.5
/100
|
#135
Excellent
75.5%
Immigrants | Brazil
84.8
/100
|
#136
Excellent
75.5%