Immigrants from South Central Asia vs Immigrants from Uganda In Labor Force | Age 25-29

COMPARE

Immigrants from South Central Asia
Race
Ancestry
AfghanAfricanAlaska NativeAlaskan AthabascanAlbanianAleutAlsatianAmericanApacheArabArapahoArgentineanArmenianAssyrian/Chaldean/SyriacAustralianAustrianBahamianBangladeshiBarbadianBasqueBelgianBelizeanBermudanBhutaneseBlackfeetBolivianBrazilianBritishBritish West IndianBulgarianBurmeseCajunCambodianCanadianCape VerdeanCarpatho RusynCelticCentral AmericanCentral American IndianCherokeeCheyenneChickasawChileanChineseChippewaChoctawColombianColvilleComancheCosta RicanCreeCreekCroatianCrowCubanCypriotCzechCzechoslovakianDanishDelawareDominicanDutchDutch West IndianEastern EuropeanEcuadorianEgyptianEnglishEstonianEthiopianEuropeanFijianFilipinoFinnishFrenchFrench American IndianFrench CanadianGermanGerman RussianGhanaianGreekGuamanian/ChamorroGuatemalanGuyaneseHaitianHmongHonduranHopiHoumaHungarianIcelanderIndian (Asian)IndonesianInupiatIranianIraqiIrishIroquoisIsraeliItalianJamaicanJapaneseJordanianKenyanKiowaKoreanLaotianLatvianLebaneseLiberianLithuanianLumbeeLuxembourgerMacedonianMalaysianMalteseMarshalleseMenomineeMexicanMexican American IndianMongolianMoroccanNative HawaiianNavajoNepaleseNew ZealanderNicaraguanNigerianNorthern EuropeanNorwegianOkinawanOsageOttawaPaiutePakistaniPalestinianPanamanianParaguayanPennsylvania GermanPeruvianPimaPolishPortuguesePotawatomiPuebloPuerto RicanPuget Sound SalishRomanianRussianSalvadoranSamoanScandinavianScotch-IrishScottishSeminoleSenegaleseSerbianShoshoneSierra LeoneanSiouxSlavicSlovakSloveneSomaliSouth AfricanSouth AmericanSouth American IndianSoviet UnionSpaniardSpanishSpanish AmericanSpanish American IndianSri LankanSubsaharan AfricanSudaneseSwedishSwissSyrianTaiwaneseThaiTlingit-HaidaTohono O'OdhamTonganTrinidadian and TobagonianTsimshianTurkishU.S. Virgin IslanderUgandanUkrainianUruguayanUteVenezuelanVietnameseWelshWest IndianYakamaYaquiYugoslavianYumanYup'ikZimbabwean
Immigration
NonimmigrantsImmigrantsAfghanistanAfricaAlbaniaArgentinaArmeniaAsiaAustraliaAustriaBahamasBangladeshBarbadosBelarusBelgiumBelizeBoliviaBosnia and HerzegovinaBrazilBulgariaBurma/MyanmarCabo VerdeCambodiaCameroonCanadaCaribbeanCentral AmericaChileChinaColombiaCongoCosta RicaCroatiaCubaCzechoslovakiaDenmarkDominicaDominican RepublicEastern AfricaEastern AsiaEastern EuropeEcuadorEgyptEl SalvadorEnglandEritreaEthiopiaEuropeFijiFranceGermanyGhanaGreeceGrenadaGuatemalaGuyanaHaitiHondurasHong KongHungaryIndiaIndonesiaIranIraqIrelandIsraelItalyJamaicaJapanJordanKazakhstanKenyaKoreaKuwaitLaosLatin AmericaLatviaLebanonLiberiaLithuaniaMalaysiaMexicoMicronesiaMiddle AfricaMoldovaMoroccoNepalNetherlandsNicaraguaNigeriaNorth AmericaNorth MacedoniaNorthern AfricaNorthern EuropeNorwayOceaniaPakistanPanamaPeruPhilippinesPolandPortugalRomaniaRussiaSaudi ArabiaScotlandSenegalSerbiaSierra LeoneSingaporeSomaliaSouth AfricaSouth AmericaSouth Central AsiaSouth Eastern AsiaSouthern EuropeSpainSri LankaSt. Vincent and the GrenadinesSudanSwedenSwitzerlandSyriaTaiwanThailandTrinidad and TobagoTurkeyUkraineUruguayUzbekistanVenezuelaVietnamWest IndiesWestern AfricaWestern AsiaWestern EuropeYemenZaireZimbabweAzores
Immigrants from Uganda
Race
Ancestry
AfghanAfricanAlaska NativeAlaskan AthabascanAlbanianAleutAlsatianAmericanApacheArabArapahoArgentineanArmenianAssyrian/Chaldean/SyriacAustralianAustrianBahamianBangladeshiBarbadianBasqueBelgianBelizeanBermudanBhutaneseBlackfeetBolivianBrazilianBritishBritish West IndianBulgarianBurmeseCajunCambodianCanadianCape VerdeanCarpatho RusynCelticCentral AmericanCentral American IndianCherokeeCheyenneChickasawChileanChineseChippewaChoctawColombianColvilleComancheCosta RicanCreeCreekCroatianCrowCubanCypriotCzechCzechoslovakianDanishDelawareDominicanDutchDutch West IndianEastern EuropeanEcuadorianEgyptianEnglishEstonianEthiopianEuropeanFijianFilipinoFinnishFrenchFrench American IndianFrench CanadianGermanGerman RussianGhanaianGreekGuamanian/ChamorroGuatemalanGuyaneseHaitianHmongHonduranHopiHoumaHungarianIcelanderIndian (Asian)IndonesianInupiatIranianIraqiIrishIroquoisIsraeliItalianJamaicanJapaneseJordanianKenyanKiowaKoreanLaotianLatvianLebaneseLiberianLithuanianLumbeeLuxembourgerMacedonianMalaysianMalteseMarshalleseMenomineeMexicanMexican American IndianMongolianMoroccanNative HawaiianNavajoNepaleseNew ZealanderNicaraguanNigerianNorthern EuropeanNorwegianOkinawanOsageOttawaPaiutePakistaniPalestinianPanamanianParaguayanPennsylvania GermanPeruvianPimaPolishPortuguesePotawatomiPuebloPuerto RicanPuget Sound SalishRomanianRussianSalvadoranSamoanScandinavianScotch-IrishScottishSeminoleSenegaleseSerbianShoshoneSierra LeoneanSiouxSlavicSlovakSloveneSomaliSouth AfricanSouth AmericanSouth American IndianSoviet UnionSpaniardSpanishSpanish AmericanSpanish American IndianSri LankanSubsaharan AfricanSudaneseSwedishSwissSyrianTaiwaneseThaiTlingit-HaidaTohono O'OdhamTonganTrinidadian and TobagonianTsimshianTurkishU.S. Virgin IslanderUgandanUkrainianUruguayanUteVenezuelanVietnameseWelshWest IndianYakamaYaquiYugoslavianYumanYup'ikZimbabwean
Immigration
NonimmigrantsImmigrantsAfghanistanAfricaAlbaniaArgentinaArmeniaAsiaAustraliaAustriaBahamasBangladeshBarbadosBelarusBelgiumBelizeBoliviaBosnia and HerzegovinaBrazilBulgariaBurma/MyanmarCabo VerdeCambodiaCameroonCanadaCaribbeanCentral AmericaChileChinaColombiaCongoCosta RicaCroatiaCubaCzechoslovakiaDenmarkDominicaDominican RepublicEastern AfricaEastern AsiaEastern EuropeEcuadorEgyptEl SalvadorEnglandEritreaEthiopiaEuropeFijiFranceGermanyGhanaGreeceGrenadaGuatemalaGuyanaHaitiHondurasHong KongHungaryIndiaIndonesiaIranIraqIrelandIsraelItalyJamaicaJapanJordanKazakhstanKenyaKoreaKuwaitLaosLatin AmericaLatviaLebanonLiberiaLithuaniaMalaysiaMexicoMicronesiaMiddle AfricaMoldovaMoroccoNepalNetherlandsNicaraguaNigeriaNorth AmericaNorth MacedoniaNorthern AfricaNorthern EuropeNorwayOceaniaPakistanPanamaPeruPhilippinesPolandPortugalRomaniaRussiaSaudi ArabiaScotlandSenegalSerbiaSierra LeoneSingaporeSomaliaSouth AfricaSouth AmericaSouth Eastern AsiaSouthern EuropeSpainSri LankaSt. Vincent and the GrenadinesSudanSwedenSwitzerlandSyriaTaiwanThailandTrinidad and TobagoTurkeyUgandaUkraineUruguayUzbekistanVenezuelaVietnamWest IndiesWestern AfricaWestern AsiaWestern EuropeYemenZaireZimbabweAzores
In Labor Force | Age 25-29
Income
Poverty
Unemployment
Labor Participation
Family Structure
Vehicle Availability
Education Level
Disability

In Labor Force | Age 25-29 Comparison

Immigrants from South Central Asia

Immigrants from Uganda

Exceptional
Exceptional
85.2%
IN LABOR FORCE | AGE 25-29
97.9/ 100
METRIC RATING
77th/ 347
METRIC RANK
86.0%
IN LABOR FORCE | AGE 25-29
100.0/ 100
METRIC RATING
23rd/ 347
METRIC RANK

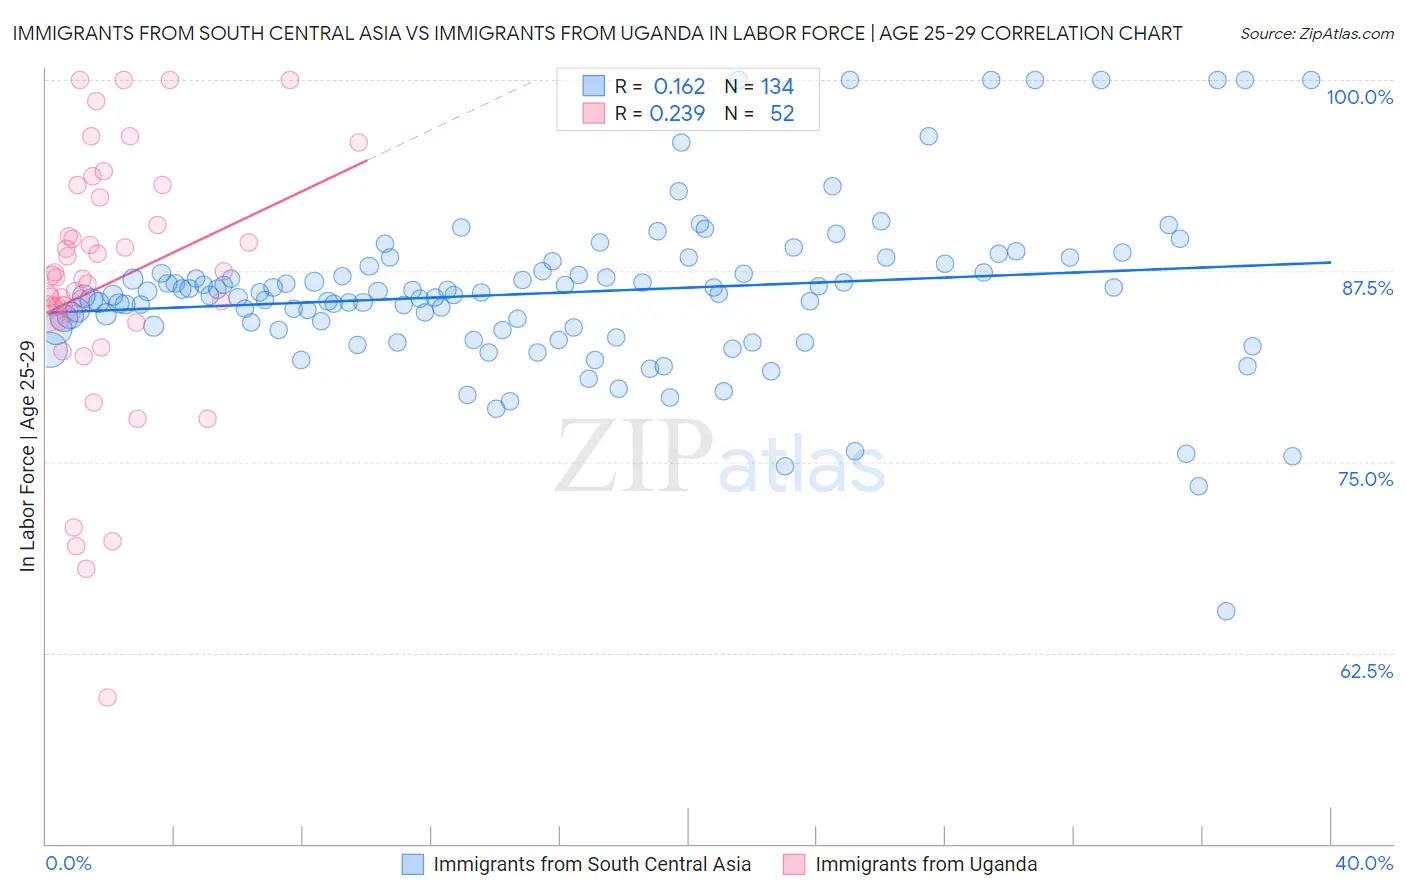
Immigrants from South Central Asia vs Immigrants from Uganda In Labor Force | Age 25-29 Correlation Chart

The statistical analysis conducted on geographies consisting of 472,851,475 people shows a poor positive correlation between the proportion of Immigrants from South Central Asia and labor force participation rate among population between the ages 25 and 29 in the United States with a correlation coefficient (R) of 0.162 and weighted average of 85.2%. Similarly, the statistical analysis conducted on geographies consisting of 125,979,949 people shows a weak positive correlation between the proportion of Immigrants from Uganda and labor force participation rate among population between the ages 25 and 29 in the United States with a correlation coefficient (R) of 0.239 and weighted average of 86.0%, a difference of 0.84%.
Immigrants from South Central Asia vs Immigrants from Uganda In Labor Force | Age 25-29

In Labor Force | Age 25-29 Correlation Summary

MeasurementImmigrants from South Central AsiaImmigrants from Uganda
Minimum65.2%59.6%
Maximum100.0%100.0%
Range34.8%40.4%
Mean86.1%86.7%
Median86.0%87.0%
Interquartile 25% (IQ1)83.7%84.5%
Interquartile 75% (IQ3)87.5%91.4%
Interquartile Range (IQR)3.7%6.9%
Standard Deviation (Sample)5.3%8.4%
Standard Deviation (Population)5.3%8.4%

Similar Demographics by In Labor Force | Age 25-29

Demographics Similar to Immigrants from South Central Asia by In Labor Force | Age 25-29

In terms of in labor force | age 25-29, the demographic groups most similar to Immigrants from South Central Asia are German (85.3%, a difference of 0.020%), Immigrants from Egypt (85.2%, a difference of 0.020%), Immigrants from Northern Africa (85.2%, a difference of 0.020%), Immigrants from Zimbabwe (85.2%, a difference of 0.030%), and Brazilian (85.3%, a difference of 0.040%).
DemographicsRating | RankIn Labor Force | Age 25-29
Immigrants | Sweden
99.1
/100
|
#70
Exceptional
85.4%
Kenyans
99.0
/100
|
#71
Exceptional
85.4%
Immigrants | Australia
98.9
/100
|
#72
Exceptional
85.3%
Russians
98.8
/100
|
#73
Exceptional
85.3%
Soviet Union
98.5
/100
|
#74
Exceptional
85.3%
Brazilians
98.3
/100
|
#75
Exceptional
85.3%
Germans
98.1
/100
|
#76
Exceptional
85.3%
Immigrants | South Central Asia
97.9
/100
|
#77
Exceptional
85.2%
Immigrants | Egypt
97.7
/100
|
#78
Exceptional
85.2%
Immigrants | Northern Africa
97.6
/100
|
#79
Exceptional
85.2%
Immigrants | Zimbabwe
97.6
/100
|
#80
Exceptional
85.2%
Immigrants | Northern Europe
97.2
/100
|
#81
Exceptional
85.2%
Okinawans
97.0
/100
|
#82
Exceptional
85.2%
Immigrants | Europe
96.8
/100
|
#83
Exceptional
85.2%
Immigrants | Eastern Europe
96.8
/100
|
#84
Exceptional
85.2%

Demographics Similar to Immigrants from Uganda by In Labor Force | Age 25-29

In terms of in labor force | age 25-29, the demographic groups most similar to Immigrants from Uganda are Immigrants from Eastern Africa (86.0%, a difference of 0.010%), Cambodian (86.0%, a difference of 0.020%), Sudanese (85.9%, a difference of 0.020%), Maltese (86.0%, a difference of 0.030%), and Immigrants from Ireland (86.0%, a difference of 0.040%).
DemographicsRating | RankIn Labor Force | Age 25-29
Immigrants | Bolivia
100.0
/100
|
#16
Exceptional
86.1%
Bermudans
100.0
/100
|
#17
Exceptional
86.0%
Bulgarians
100.0
/100
|
#18
Exceptional
86.0%
Cape Verdeans
100.0
/100
|
#19
Exceptional
86.0%
Immigrants | Ireland
100.0
/100
|
#20
Exceptional
86.0%
Maltese
100.0
/100
|
#21
Exceptional
86.0%
Cambodians
100.0
/100
|
#22
Exceptional
86.0%
Immigrants | Uganda
100.0
/100
|
#23
Exceptional
86.0%
Immigrants | Eastern Africa
100.0
/100
|
#24
Exceptional
86.0%
Sudanese
100.0
/100
|
#25
Exceptional
85.9%
Immigrants | North Macedonia
100.0
/100
|
#26
Exceptional
85.9%
Paraguayans
100.0
/100
|
#27
Exceptional
85.9%
Ugandans
100.0
/100
|
#28
Exceptional
85.9%
Immigrants | Liberia
100.0
/100
|
#29
Exceptional
85.9%
Immigrants | Serbia
100.0
/100
|
#30
Exceptional
85.9%