Immigrants from South America vs Sudanese In Labor Force | Age 25-29

COMPARE

Immigrants from South America
Race
Ancestry
AfghanAfricanAlaska NativeAlaskan AthabascanAlbanianAleutAlsatianAmericanApacheArabArapahoArgentineanArmenianAssyrian/Chaldean/SyriacAustralianAustrianBahamianBangladeshiBarbadianBasqueBelgianBelizeanBermudanBhutaneseBlackfeetBolivianBrazilianBritishBritish West IndianBulgarianBurmeseCajunCambodianCanadianCape VerdeanCarpatho RusynCelticCentral AmericanCentral American IndianCherokeeCheyenneChickasawChileanChineseChippewaChoctawColombianColvilleComancheCosta RicanCreeCreekCroatianCrowCubanCypriotCzechCzechoslovakianDanishDelawareDominicanDutchDutch West IndianEastern EuropeanEcuadorianEgyptianEnglishEstonianEthiopianEuropeanFijianFilipinoFinnishFrenchFrench American IndianFrench CanadianGermanGerman RussianGhanaianGreekGuamanian/ChamorroGuatemalanGuyaneseHaitianHmongHonduranHopiHoumaHungarianIcelanderIndian (Asian)IndonesianInupiatIranianIraqiIrishIroquoisIsraeliItalianJamaicanJapaneseJordanianKenyanKiowaKoreanLaotianLatvianLebaneseLiberianLithuanianLumbeeLuxembourgerMacedonianMalaysianMalteseMarshalleseMenomineeMexicanMexican American IndianMongolianMoroccanNative HawaiianNavajoNepaleseNew ZealanderNicaraguanNigerianNorthern EuropeanNorwegianOkinawanOsageOttawaPaiutePakistaniPalestinianPanamanianParaguayanPennsylvania GermanPeruvianPimaPolishPortuguesePotawatomiPuebloPuerto RicanPuget Sound SalishRomanianRussianSalvadoranSamoanScandinavianScotch-IrishScottishSeminoleSenegaleseSerbianShoshoneSierra LeoneanSiouxSlavicSlovakSloveneSomaliSouth AfricanSouth AmericanSouth American IndianSoviet UnionSpaniardSpanishSpanish AmericanSpanish American IndianSri LankanSubsaharan AfricanSwedishSwissSyrianTaiwaneseThaiTlingit-HaidaTohono O'OdhamTonganTrinidadian and TobagonianTsimshianTurkishU.S. Virgin IslanderUgandanUkrainianUruguayanUteVenezuelanVietnameseWelshWest IndianYakamaYaquiYugoslavianYumanYup'ikZimbabwean
Immigration
NonimmigrantsImmigrantsAfghanistanAfricaAlbaniaArgentinaArmeniaAsiaAustraliaAustriaBahamasBangladeshBarbadosBelarusBelgiumBelizeBoliviaBosnia and HerzegovinaBrazilBulgariaBurma/MyanmarCabo VerdeCambodiaCameroonCanadaCaribbeanCentral AmericaChileChinaColombiaCongoCosta RicaCroatiaCubaCzechoslovakiaDenmarkDominicaDominican RepublicEastern AfricaEastern AsiaEastern EuropeEcuadorEgyptEl SalvadorEnglandEritreaEthiopiaEuropeFijiFranceGermanyGhanaGreeceGrenadaGuatemalaGuyanaHaitiHondurasHong KongHungaryIndiaIndonesiaIranIraqIrelandIsraelItalyJamaicaJapanJordanKazakhstanKenyaKoreaKuwaitLaosLatin AmericaLatviaLebanonLiberiaLithuaniaMalaysiaMexicoMicronesiaMiddle AfricaMoldovaMoroccoNepalNetherlandsNicaraguaNigeriaNorth AmericaNorth MacedoniaNorthern AfricaNorthern EuropeNorwayOceaniaPakistanPanamaPeruPhilippinesPolandPortugalRomaniaRussiaSaudi ArabiaScotlandSenegalSerbiaSierra LeoneSingaporeSomaliaSouth AfricaSouth AmericaSouth Central AsiaSouth Eastern AsiaSouthern EuropeSpainSri LankaSt. Vincent and the GrenadinesSudanSwedenSwitzerlandSyriaTaiwanThailandTrinidad and TobagoTurkeyUgandaUkraineUruguayUzbekistanVenezuelaVietnamWest IndiesWestern AfricaWestern AsiaWestern EuropeYemenZaireZimbabweAzores
Sudanese
Race
Ancestry
AfghanAfricanAlaska NativeAlaskan AthabascanAlbanianAleutAlsatianAmericanApacheArabArapahoArgentineanArmenianAssyrian/Chaldean/SyriacAustralianAustrianBahamianBangladeshiBarbadianBasqueBelgianBelizeanBermudanBhutaneseBlackfeetBolivianBrazilianBritishBritish West IndianBulgarianBurmeseCajunCambodianCanadianCape VerdeanCarpatho RusynCelticCentral AmericanCentral American IndianCherokeeCheyenneChickasawChileanChineseChippewaChoctawColombianColvilleComancheCosta RicanCreeCreekCroatianCrowCubanCypriotCzechCzechoslovakianDanishDelawareDominicanDutchDutch West IndianEastern EuropeanEcuadorianEgyptianEnglishEstonianEthiopianEuropeanFijianFilipinoFinnishFrenchFrench American IndianFrench CanadianGermanGerman RussianGhanaianGreekGuamanian/ChamorroGuatemalanGuyaneseHaitianHmongHonduranHopiHoumaHungarianIcelanderIndian (Asian)IndonesianInupiatIranianIraqiIrishIroquoisIsraeliItalianJamaicanJapaneseJordanianKenyanKiowaKoreanLaotianLatvianLebaneseLiberianLithuanianLumbeeLuxembourgerMacedonianMalaysianMalteseMarshalleseMenomineeMexicanMexican American IndianMongolianMoroccanNative HawaiianNavajoNepaleseNew ZealanderNicaraguanNigerianNorthern EuropeanNorwegianOkinawanOsageOttawaPaiutePakistaniPalestinianPanamanianParaguayanPennsylvania GermanPeruvianPimaPolishPortuguesePotawatomiPuebloPuerto RicanPuget Sound SalishRomanianRussianSalvadoranSamoanScandinavianScotch-IrishScottishSeminoleSenegaleseSerbianShoshoneSierra LeoneanSiouxSlavicSlovakSloveneSomaliSouth AfricanSouth AmericanSouth American IndianSoviet UnionSpaniardSpanishSpanish AmericanSpanish American IndianSri LankanSubsaharan AfricanSudaneseSwedishSwissSyrianTaiwaneseThaiTlingit-HaidaTohono O'OdhamTonganTrinidadian and TobagonianTsimshianTurkishU.S. Virgin IslanderUgandanUkrainianUruguayanUteVenezuelanVietnameseWelshWest IndianYakamaYaquiYugoslavianYumanYup'ikZimbabwean
Immigration
NonimmigrantsImmigrantsAfghanistanAfricaAlbaniaArgentinaArmeniaAsiaAustraliaAustriaBahamasBangladeshBarbadosBelarusBelgiumBelizeBoliviaBosnia and HerzegovinaBrazilBulgariaBurma/MyanmarCabo VerdeCambodiaCameroonCanadaCaribbeanCentral AmericaChileChinaColombiaCongoCosta RicaCroatiaCubaCzechoslovakiaDenmarkDominicaDominican RepublicEastern AfricaEastern AsiaEastern EuropeEcuadorEgyptEl SalvadorEnglandEritreaEthiopiaEuropeFijiFranceGermanyGhanaGreeceGrenadaGuatemalaGuyanaHaitiHondurasHong KongHungaryIndiaIndonesiaIranIraqIrelandIsraelItalyJamaicaJapanJordanKazakhstanKenyaKoreaKuwaitLaosLatin AmericaLatviaLebanonLiberiaLithuaniaMalaysiaMexicoMicronesiaMiddle AfricaMoldovaMoroccoNepalNetherlandsNicaraguaNigeriaNorth AmericaNorth MacedoniaNorthern AfricaNorthern EuropeNorwayOceaniaPakistanPanamaPeruPhilippinesPolandPortugalRomaniaRussiaSaudi ArabiaScotlandSenegalSerbiaSierra LeoneSingaporeSomaliaSouth AfricaSouth Central AsiaSouth Eastern AsiaSouthern EuropeSpainSri LankaSt. Vincent and the GrenadinesSudanSwedenSwitzerlandSyriaTaiwanThailandTrinidad and TobagoTurkeyUgandaUkraineUruguayUzbekistanVenezuelaVietnamWest IndiesWestern AfricaWestern AsiaWestern EuropeYemenZaireZimbabweAzores
In Labor Force | Age 25-29
Income
Poverty
Unemployment
Labor Participation
Family Structure
Vehicle Availability
Education Level
Disability

In Labor Force | Age 25-29 Comparison

Immigrants from South America

Sudanese

Average
Exceptional
84.6%
IN LABOR FORCE | AGE 25-29
42.9/ 100
METRIC RATING
180th/ 347
METRIC RANK
85.9%
IN LABOR FORCE | AGE 25-29
100.0/ 100
METRIC RATING
25th/ 347
METRIC RANK

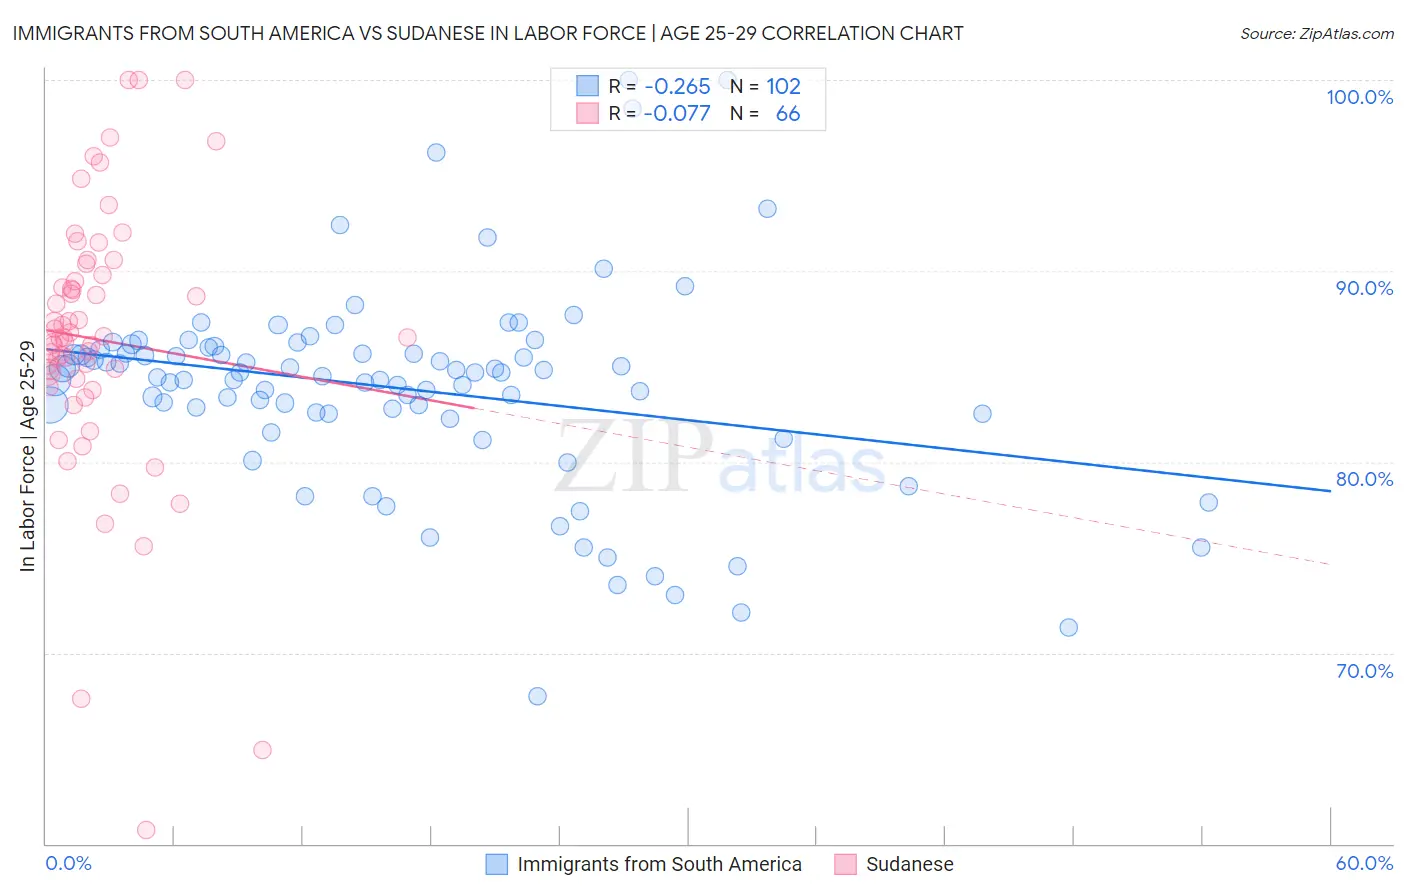
Immigrants from South America vs Sudanese In Labor Force | Age 25-29 Correlation Chart

The statistical analysis conducted on geographies consisting of 486,086,715 people shows a weak negative correlation between the proportion of Immigrants from South America and labor force participation rate among population between the ages 25 and 29 in the United States with a correlation coefficient (R) of -0.265 and weighted average of 84.6%. Similarly, the statistical analysis conducted on geographies consisting of 110,131,704 people shows a slight negative correlation between the proportion of Sudanese and labor force participation rate among population between the ages 25 and 29 in the United States with a correlation coefficient (R) of -0.077 and weighted average of 85.9%, a difference of 1.6%.
Immigrants from South America vs Sudanese In Labor Force | Age 25-29

In Labor Force | Age 25-29 Correlation Summary

MeasurementImmigrants from South AmericaSudanese
Minimum67.7%60.7%
Maximum100.0%100.0%
Range32.3%39.3%
Mean83.8%86.4%
Median84.6%86.5%
Interquartile 25% (IQ1)82.5%84.3%
Interquartile 75% (IQ3)85.9%89.8%
Interquartile Range (IQR)3.4%5.5%
Standard Deviation (Sample)5.4%7.2%
Standard Deviation (Population)5.4%7.1%

Similar Demographics by In Labor Force | Age 25-29

Demographics Similar to Immigrants from South America by In Labor Force | Age 25-29

In terms of in labor force | age 25-29, the demographic groups most similar to Immigrants from South America are Immigrants from Argentina (84.6%, a difference of 0.010%), Immigrants from Norway (84.6%, a difference of 0.010%), Immigrants from China (84.6%, a difference of 0.020%), Immigrants from Thailand (84.6%, a difference of 0.020%), and European (84.6%, a difference of 0.020%).
DemographicsRating | RankIn Labor Force | Age 25-29
Assyrians/Chaldeans/Syriacs
50.2
/100
|
#173
Average
84.7%
Palestinians
50.0
/100
|
#174
Average
84.7%
Hungarians
47.8
/100
|
#175
Average
84.6%
Malaysians
46.8
/100
|
#176
Average
84.6%
Immigrants | China
45.7
/100
|
#177
Average
84.6%
Immigrants | Thailand
45.2
/100
|
#178
Average
84.6%
Immigrants | Argentina
44.0
/100
|
#179
Average
84.6%
Immigrants | South America
42.9
/100
|
#180
Average
84.6%
Immigrants | Norway
41.9
/100
|
#181
Average
84.6%
Europeans
40.3
/100
|
#182
Average
84.6%
Scottish
40.1
/100
|
#183
Average
84.6%
Immigrants | Kuwait
38.2
/100
|
#184
Fair
84.6%
Immigrants | Denmark
37.0
/100
|
#185
Fair
84.6%
Immigrants | Belgium
35.0
/100
|
#186
Fair
84.6%
Immigrants | Portugal
34.7
/100
|
#187
Fair
84.6%

Demographics Similar to Sudanese by In Labor Force | Age 25-29

In terms of in labor force | age 25-29, the demographic groups most similar to Sudanese are Immigrants from Eastern Africa (86.0%, a difference of 0.010%), Immigrants from Uganda (86.0%, a difference of 0.020%), Cambodian (86.0%, a difference of 0.040%), Maltese (86.0%, a difference of 0.050%), and Immigrants from Ireland (86.0%, a difference of 0.060%).
DemographicsRating | RankIn Labor Force | Age 25-29
Bulgarians
100.0
/100
|
#18
Exceptional
86.0%
Cape Verdeans
100.0
/100
|
#19
Exceptional
86.0%
Immigrants | Ireland
100.0
/100
|
#20
Exceptional
86.0%
Maltese
100.0
/100
|
#21
Exceptional
86.0%
Cambodians
100.0
/100
|
#22
Exceptional
86.0%
Immigrants | Uganda
100.0
/100
|
#23
Exceptional
86.0%
Immigrants | Eastern Africa
100.0
/100
|
#24
Exceptional
86.0%
Sudanese
100.0
/100
|
#25
Exceptional
85.9%
Immigrants | North Macedonia
100.0
/100
|
#26
Exceptional
85.9%
Paraguayans
100.0
/100
|
#27
Exceptional
85.9%
Ugandans
100.0
/100
|
#28
Exceptional
85.9%
Immigrants | Liberia
100.0
/100
|
#29
Exceptional
85.9%
Immigrants | Serbia
100.0
/100
|
#30
Exceptional
85.9%
German Russians
100.0
/100
|
#31
Exceptional
85.8%
Slovaks
100.0
/100
|
#32
Exceptional
85.8%