Immigrants from South Africa vs Korean In Labor Force | Age 16-19
COMPARE
Immigrants from South Africa
Korean
In Labor Force | Age 16-19
In Labor Force | Age 16-19 Comparison
Immigrants from South Africa
Koreans
36.8%
IN LABOR FORCE | AGE 16-19
60.5/ 100
METRIC RATING
170th/ 347
METRIC RANK
35.7%
IN LABOR FORCE | AGE 16-19
13.3/ 100
METRIC RATING
208th/ 347
METRIC RANK
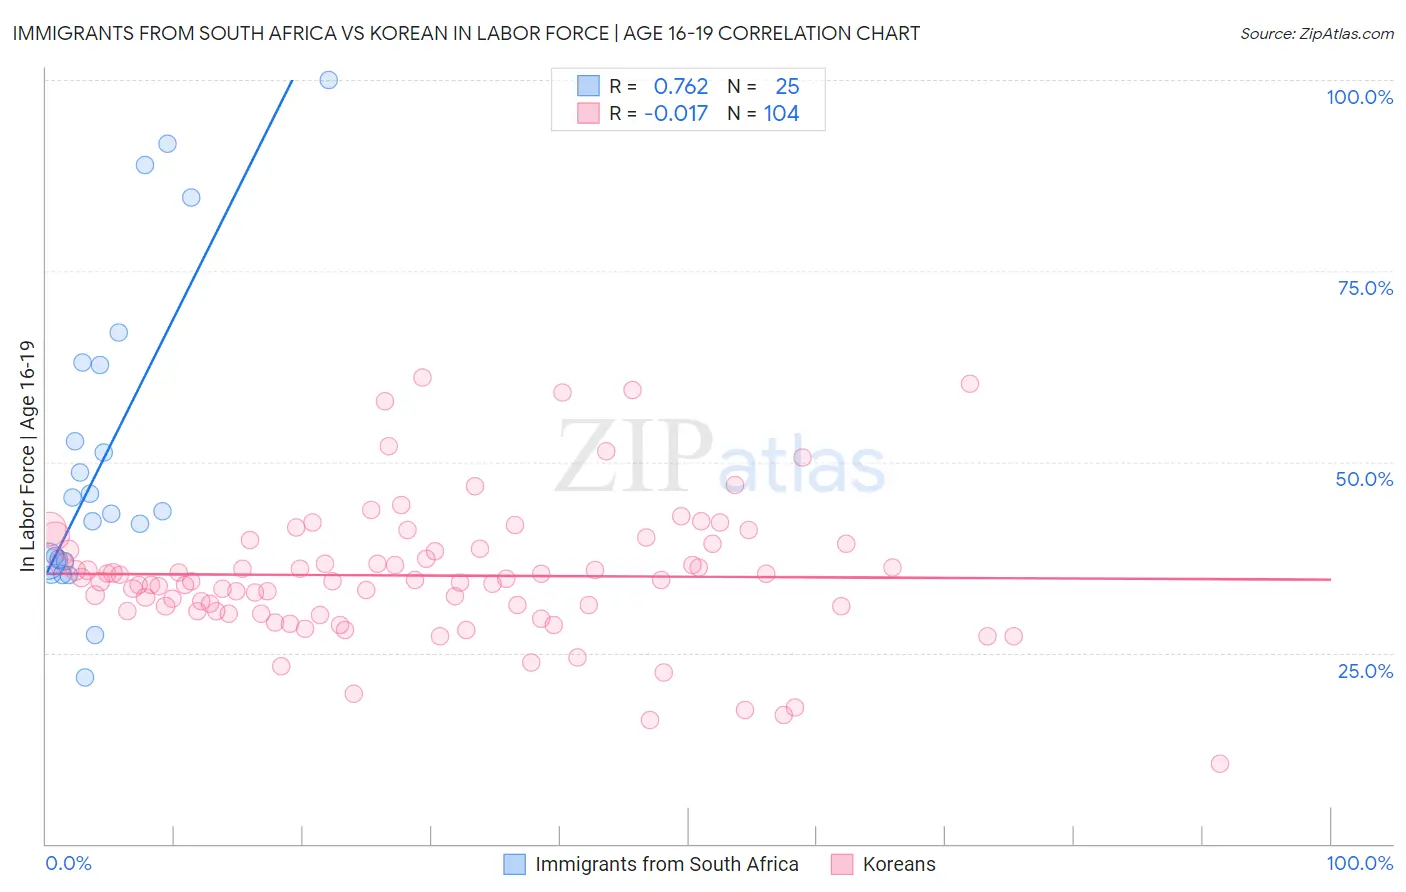
Immigrants from South Africa vs Korean In Labor Force | Age 16-19 Correlation Chart
The statistical analysis conducted on geographies consisting of 232,958,453 people shows a strong positive correlation between the proportion of Immigrants from South Africa and labor force participation rate among population between the ages 16 and 19 in the United States with a correlation coefficient (R) of 0.762 and weighted average of 36.8%. Similarly, the statistical analysis conducted on geographies consisting of 509,513,033 people shows no correlation between the proportion of Koreans and labor force participation rate among population between the ages 16 and 19 in the United States with a correlation coefficient (R) of -0.017 and weighted average of 35.7%, a difference of 3.0%.
In Labor Force | Age 16-19 Correlation Summary
| Measurement | Immigrants from South Africa | Korean |
| Minimum | 21.8% | 10.4% |
| Maximum | 100.0% | 61.1% |
| Range | 78.2% | 50.7% |
| Mean | 51.0% | 35.1% |
| Median | 43.5% | 34.4% |
| Interquartile 25% (IQ1) | 37.0% | 30.5% |
| Interquartile 75% (IQ3) | 62.9% | 39.0% |
| Interquartile Range (IQR) | 25.9% | 8.4% |
| Standard Deviation (Sample) | 20.8% | 9.0% |
| Standard Deviation (Population) | 20.4% | 8.9% |
Similar Demographics by In Labor Force | Age 16-19
Demographics Similar to Immigrants from South Africa by In Labor Force | Age 16-19
In terms of in labor force | age 16-19, the demographic groups most similar to Immigrants from South Africa are Immigrants from Latvia (36.8%, a difference of 0.060%), Immigrants from Cambodia (36.7%, a difference of 0.11%), South African (36.7%, a difference of 0.11%), Palestinian (36.8%, a difference of 0.14%), and Russian (36.7%, a difference of 0.15%).
| Demographics | Rating | Rank | In Labor Force | Age 16-19 |
| Bermudans | 69.3 /100 | #163 | Good 36.9% |
| Immigrants | Kuwait | 68.9 /100 | #164 | Good 36.9% |
| Yakama | 66.9 /100 | #165 | Good 36.9% |
| Immigrants | Western Africa | 66.7 /100 | #166 | Good 36.9% |
| Arabs | 63.6 /100 | #167 | Good 36.8% |
| Palestinians | 63.1 /100 | #168 | Good 36.8% |
| Immigrants | Latvia | 61.6 /100 | #169 | Good 36.8% |
| Immigrants | South Africa | 60.5 /100 | #170 | Good 36.8% |
| Immigrants | Cambodia | 58.4 /100 | #171 | Average 36.7% |
| South Africans | 58.3 /100 | #172 | Average 36.7% |
| Russians | 57.5 /100 | #173 | Average 36.7% |
| Immigrants | Czechoslovakia | 50.0 /100 | #174 | Average 36.6% |
| Natives/Alaskans | 49.0 /100 | #175 | Average 36.6% |
| Albanians | 48.8 /100 | #176 | Average 36.5% |
| Immigrants | Northern Europe | 46.6 /100 | #177 | Average 36.5% |
Demographics Similar to Koreans by In Labor Force | Age 16-19
In terms of in labor force | age 16-19, the demographic groups most similar to Koreans are Moroccan (35.7%, a difference of 0.070%), Immigrants from Eastern Europe (35.8%, a difference of 0.12%), South American Indian (35.8%, a difference of 0.14%), Chilean (35.8%, a difference of 0.14%), and Immigrants from Albania (35.8%, a difference of 0.17%).
| Demographics | Rating | Rank | In Labor Force | Age 16-19 |
| Alsatians | 17.5 /100 | #201 | Poor 35.9% |
| Senegalese | 17.4 /100 | #202 | Poor 35.9% |
| Immigrants | Nigeria | 16.8 /100 | #203 | Poor 35.8% |
| Immigrants | Albania | 15.0 /100 | #204 | Poor 35.8% |
| South American Indians | 14.6 /100 | #205 | Poor 35.8% |
| Chileans | 14.6 /100 | #206 | Poor 35.8% |
| Immigrants | Eastern Europe | 14.5 /100 | #207 | Poor 35.8% |
| Koreans | 13.3 /100 | #208 | Poor 35.7% |
| Moroccans | 12.7 /100 | #209 | Poor 35.7% |
| Immigrants | Switzerland | 11.9 /100 | #210 | Poor 35.6% |
| Mexicans | 11.9 /100 | #211 | Poor 35.6% |
| Houma | 11.0 /100 | #212 | Poor 35.6% |
| Immigrants | Bolivia | 11.0 /100 | #213 | Poor 35.6% |
| Apache | 11.0 /100 | #214 | Poor 35.6% |
| Immigrants | South Eastern Asia | 10.8 /100 | #215 | Poor 35.6% |