Immigrants from Sierra Leone vs Immigrants from Norway In Labor Force | Age 35-44

COMPARE

Immigrants from Sierra Leone
Race
Ancestry
AfghanAfricanAlaska NativeAlaskan AthabascanAlbanianAleutAlsatianAmericanApacheArabArapahoArgentineanArmenianAssyrian/Chaldean/SyriacAustralianAustrianBahamianBangladeshiBarbadianBasqueBelgianBelizeanBermudanBhutaneseBlackfeetBolivianBrazilianBritishBritish West IndianBulgarianBurmeseCajunCambodianCanadianCape VerdeanCarpatho RusynCelticCentral AmericanCentral American IndianCherokeeCheyenneChickasawChileanChineseChippewaChoctawColombianColvilleComancheCosta RicanCreeCreekCroatianCrowCubanCypriotCzechCzechoslovakianDanishDelawareDominicanDutchDutch West IndianEastern EuropeanEcuadorianEgyptianEnglishEstonianEthiopianEuropeanFijianFilipinoFinnishFrenchFrench American IndianFrench CanadianGermanGerman RussianGhanaianGreekGuamanian/ChamorroGuatemalanGuyaneseHaitianHmongHonduranHopiHoumaHungarianIcelanderIndian (Asian)IndonesianInupiatIranianIraqiIrishIroquoisIsraeliItalianJamaicanJapaneseJordanianKenyanKiowaKoreanLaotianLatvianLebaneseLiberianLithuanianLumbeeLuxembourgerMacedonianMalaysianMalteseMarshalleseMenomineeMexicanMexican American IndianMongolianMoroccanNative HawaiianNavajoNepaleseNew ZealanderNicaraguanNigerianNorthern EuropeanNorwegianOkinawanOsageOttawaPaiutePakistaniPalestinianPanamanianParaguayanPennsylvania GermanPeruvianPimaPolishPortuguesePotawatomiPuebloPuerto RicanPuget Sound SalishRomanianRussianSalvadoranSamoanScandinavianScotch-IrishScottishSeminoleSenegaleseSerbianShoshoneSierra LeoneanSiouxSlavicSlovakSloveneSomaliSouth AfricanSouth AmericanSouth American IndianSoviet UnionSpaniardSpanishSpanish AmericanSpanish American IndianSri LankanSubsaharan AfricanSudaneseSwedishSwissSyrianTaiwaneseThaiTlingit-HaidaTohono O'OdhamTonganTrinidadian and TobagonianTsimshianTurkishU.S. Virgin IslanderUgandanUkrainianUruguayanUteVenezuelanVietnameseWelshWest IndianYakamaYaquiYugoslavianYumanYup'ikZimbabwean
Immigration
NonimmigrantsImmigrantsAfghanistanAfricaAlbaniaArgentinaArmeniaAsiaAustraliaAustriaBahamasBangladeshBarbadosBelarusBelgiumBelizeBoliviaBosnia and HerzegovinaBrazilBulgariaBurma/MyanmarCabo VerdeCambodiaCameroonCanadaCaribbeanCentral AmericaChileChinaColombiaCongoCosta RicaCroatiaCubaCzechoslovakiaDenmarkDominicaDominican RepublicEastern AfricaEastern AsiaEastern EuropeEcuadorEgyptEl SalvadorEnglandEritreaEthiopiaEuropeFijiFranceGermanyGhanaGreeceGrenadaGuatemalaGuyanaHaitiHondurasHong KongHungaryIndiaIndonesiaIranIraqIrelandIsraelItalyJamaicaJapanJordanKazakhstanKenyaKoreaKuwaitLaosLatin AmericaLatviaLebanonLiberiaLithuaniaMalaysiaMexicoMicronesiaMiddle AfricaMoldovaMoroccoNepalNetherlandsNicaraguaNigeriaNorth AmericaNorth MacedoniaNorthern AfricaNorthern EuropeOceaniaPakistanPanamaPeruPhilippinesPolandPortugalRomaniaRussiaSaudi ArabiaScotlandSenegalSerbiaSierra LeoneSingaporeSomaliaSouth AfricaSouth AmericaSouth Central AsiaSouth Eastern AsiaSouthern EuropeSpainSri LankaSt. Vincent and the GrenadinesSudanSwedenSwitzerlandSyriaTaiwanThailandTrinidad and TobagoTurkeyUgandaUkraineUruguayUzbekistanVenezuelaVietnamWest IndiesWestern AfricaWestern AsiaWestern EuropeYemenZaireZimbabweAzores
Immigrants from Norway
Race
Ancestry
AfghanAfricanAlaska NativeAlaskan AthabascanAlbanianAleutAlsatianAmericanApacheArabArapahoArgentineanArmenianAssyrian/Chaldean/SyriacAustralianAustrianBahamianBangladeshiBarbadianBasqueBelgianBelizeanBermudanBhutaneseBlackfeetBolivianBrazilianBritishBritish West IndianBulgarianBurmeseCajunCambodianCanadianCape VerdeanCarpatho RusynCelticCentral AmericanCentral American IndianCherokeeCheyenneChickasawChileanChineseChippewaChoctawColombianColvilleComancheCosta RicanCreeCreekCroatianCrowCubanCypriotCzechCzechoslovakianDanishDelawareDominicanDutchDutch West IndianEastern EuropeanEcuadorianEgyptianEnglishEstonianEthiopianEuropeanFijianFilipinoFinnishFrenchFrench American IndianFrench CanadianGermanGerman RussianGhanaianGreekGuamanian/ChamorroGuatemalanGuyaneseHaitianHmongHonduranHopiHoumaHungarianIcelanderIndian (Asian)IndonesianInupiatIranianIraqiIrishIroquoisIsraeliItalianJamaicanJapaneseJordanianKenyanKiowaKoreanLaotianLatvianLebaneseLiberianLithuanianLumbeeLuxembourgerMacedonianMalaysianMalteseMarshalleseMenomineeMexicanMexican American IndianMongolianMoroccanNative HawaiianNavajoNepaleseNew ZealanderNicaraguanNigerianNorthern EuropeanNorwegianOkinawanOsageOttawaPaiutePakistaniPalestinianPanamanianParaguayanPennsylvania GermanPeruvianPimaPolishPortuguesePotawatomiPuebloPuerto RicanPuget Sound SalishRomanianRussianSalvadoranSamoanScandinavianScotch-IrishScottishSeminoleSenegaleseSerbianShoshoneSierra LeoneanSiouxSlavicSlovakSloveneSomaliSouth AfricanSouth AmericanSouth American IndianSoviet UnionSpaniardSpanishSpanish AmericanSpanish American IndianSri LankanSubsaharan AfricanSudaneseSwedishSwissSyrianTaiwaneseThaiTlingit-HaidaTohono O'OdhamTonganTrinidadian and TobagonianTsimshianTurkishU.S. Virgin IslanderUgandanUkrainianUruguayanUteVenezuelanVietnameseWelshWest IndianYakamaYaquiYugoslavianYumanYup'ikZimbabwean
Immigration
NonimmigrantsImmigrantsAfghanistanAfricaAlbaniaArgentinaArmeniaAsiaAustraliaAustriaBahamasBangladeshBarbadosBelarusBelgiumBelizeBoliviaBosnia and HerzegovinaBrazilBulgariaBurma/MyanmarCabo VerdeCambodiaCameroonCanadaCaribbeanCentral AmericaChileChinaColombiaCongoCosta RicaCroatiaCubaCzechoslovakiaDenmarkDominicaDominican RepublicEastern AfricaEastern AsiaEastern EuropeEcuadorEgyptEl SalvadorEnglandEritreaEthiopiaEuropeFijiFranceGermanyGhanaGreeceGrenadaGuatemalaGuyanaHaitiHondurasHong KongHungaryIndiaIndonesiaIranIraqIrelandIsraelItalyJamaicaJapanJordanKazakhstanKenyaKoreaKuwaitLaosLatin AmericaLatviaLebanonLiberiaLithuaniaMalaysiaMexicoMicronesiaMiddle AfricaMoldovaMoroccoNepalNetherlandsNicaraguaNigeriaNorth AmericaNorth MacedoniaNorthern AfricaNorthern EuropeNorwayOceaniaPakistanPanamaPeruPhilippinesPolandPortugalRomaniaRussiaSaudi ArabiaScotlandSenegalSerbiaSingaporeSomaliaSouth AfricaSouth AmericaSouth Central AsiaSouth Eastern AsiaSouthern EuropeSpainSri LankaSt. Vincent and the GrenadinesSudanSwedenSwitzerlandSyriaTaiwanThailandTrinidad and TobagoTurkeyUgandaUkraineUruguayUzbekistanVenezuelaVietnamWest IndiesWestern AfricaWestern AsiaWestern EuropeYemenZaireZimbabweAzores
In Labor Force | Age 35-44
Income
Poverty
Unemployment
Labor Participation
Family Structure
Vehicle Availability
Education Level
Disability

In Labor Force | Age 35-44 Comparison

Immigrants from Sierra Leone

Immigrants from Norway

Exceptional
Poor
86.1%
IN LABOR FORCE | AGE 35-44
100.0/ 100
METRIC RATING
7th/ 347
METRIC RANK
84.1%
IN LABOR FORCE | AGE 35-44
11.7/ 100
METRIC RATING
217th/ 347
METRIC RANK

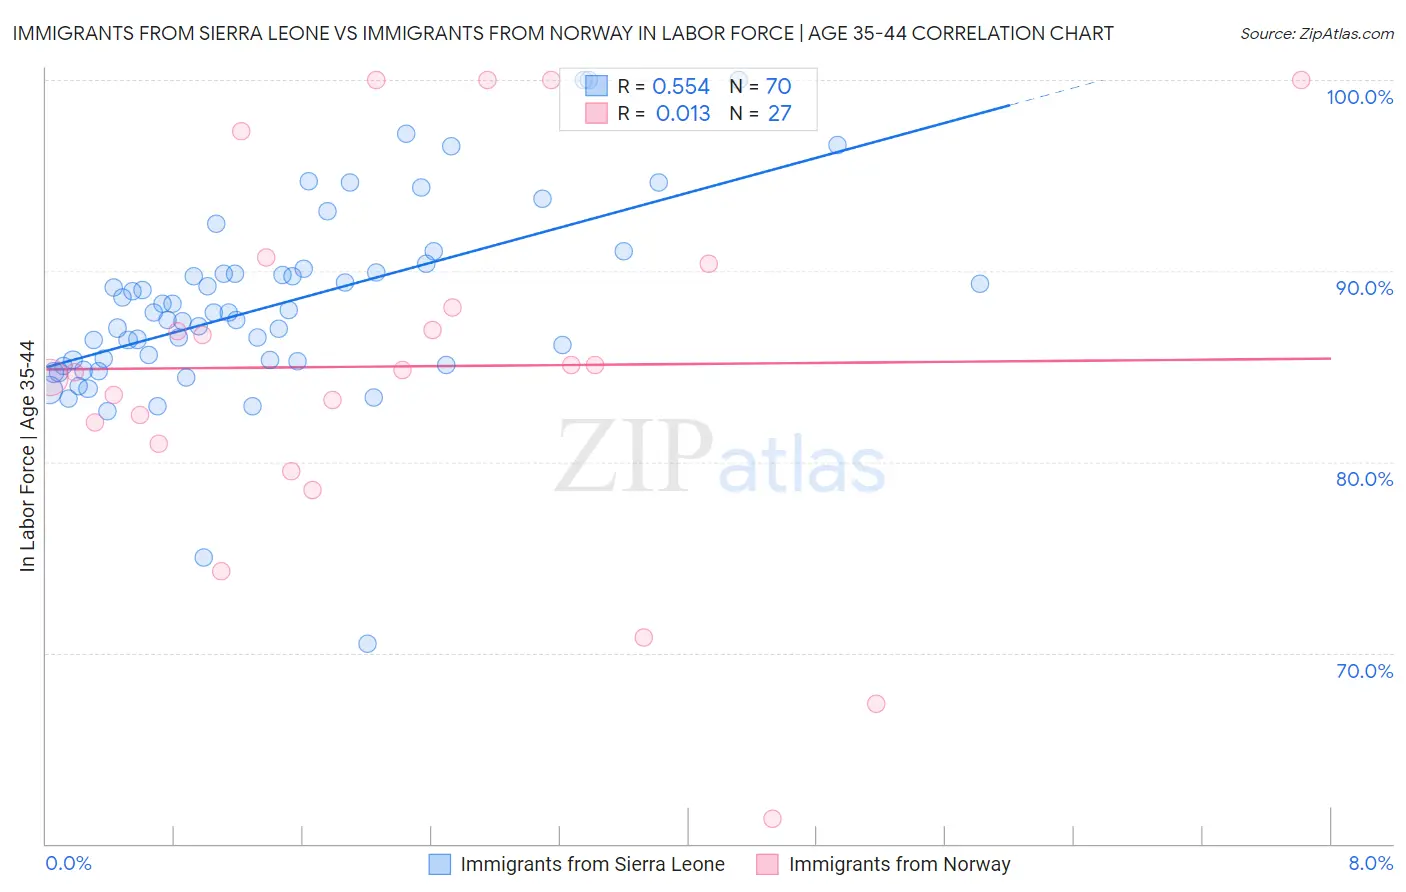
Immigrants from Sierra Leone vs Immigrants from Norway In Labor Force | Age 35-44 Correlation Chart

The statistical analysis conducted on geographies consisting of 101,643,562 people shows a substantial positive correlation between the proportion of Immigrants from Sierra Leone and labor force participation rate among population between the ages 35 and 44 in the United States with a correlation coefficient (R) of 0.554 and weighted average of 86.1%. Similarly, the statistical analysis conducted on geographies consisting of 116,704,105 people shows no correlation between the proportion of Immigrants from Norway and labor force participation rate among population between the ages 35 and 44 in the United States with a correlation coefficient (R) of 0.013 and weighted average of 84.1%, a difference of 2.3%.
Immigrants from Sierra Leone vs Immigrants from Norway In Labor Force | Age 35-44

In Labor Force | Age 35-44 Correlation Summary

MeasurementImmigrants from Sierra LeoneImmigrants from Norway
Minimum70.5%61.3%
Maximum100.0%100.0%
Range29.5%38.7%
Mean88.2%85.0%
Median87.8%84.8%
Interquartile 25% (IQ1)85.3%80.9%
Interquartile 75% (IQ3)89.9%90.4%
Interquartile Range (IQR)4.6%9.5%
Standard Deviation (Sample)5.0%9.7%
Standard Deviation (Population)5.0%9.5%

Similar Demographics by In Labor Force | Age 35-44

Demographics Similar to Immigrants from Sierra Leone by In Labor Force | Age 35-44

In terms of in labor force | age 35-44, the demographic groups most similar to Immigrants from Sierra Leone are Bolivian (86.1%, a difference of 0.040%), Zimbabwean (86.1%, a difference of 0.050%), Immigrants from Ethiopia (85.9%, a difference of 0.17%), Immigrants from Cabo Verde (86.2%, a difference of 0.18%), and Ethiopian (85.9%, a difference of 0.18%).
DemographicsRating | RankIn Labor Force | Age 35-44
Sierra Leoneans
100.0
/100
|
#1
Exceptional
86.4%
Luxembourgers
100.0
/100
|
#2
Exceptional
86.4%
Immigrants | Bolivia
100.0
/100
|
#3
Exceptional
86.2%
Immigrants | Cabo Verde
100.0
/100
|
#4
Exceptional
86.2%
Zimbabweans
100.0
/100
|
#5
Exceptional
86.1%
Bolivians
100.0
/100
|
#6
Exceptional
86.1%
Immigrants | Sierra Leone
100.0
/100
|
#7
Exceptional
86.1%
Immigrants | Ethiopia
100.0
/100
|
#8
Exceptional
85.9%
Ethiopians
100.0
/100
|
#9
Exceptional
85.9%
Cape Verdeans
100.0
/100
|
#10
Exceptional
85.8%
Immigrants | Cameroon
100.0
/100
|
#11
Exceptional
85.8%
Liberians
100.0
/100
|
#12
Exceptional
85.7%
Somalis
100.0
/100
|
#13
Exceptional
85.6%
Immigrants | Somalia
100.0
/100
|
#14
Exceptional
85.6%
Norwegians
100.0
/100
|
#15
Exceptional
85.6%

Demographics Similar to Immigrants from Norway by In Labor Force | Age 35-44

In terms of in labor force | age 35-44, the demographic groups most similar to Immigrants from Norway are European (84.1%, a difference of 0.010%), Nicaraguan (84.1%, a difference of 0.010%), Immigrants from Barbados (84.1%, a difference of 0.020%), Israeli (84.1%, a difference of 0.030%), and Bangladeshi (84.1%, a difference of 0.030%).
DemographicsRating | RankIn Labor Force | Age 35-44
New Zealanders
16.2
/100
|
#210
Poor
84.1%
Immigrants | Ecuador
15.2
/100
|
#211
Poor
84.1%
Israelis
14.0
/100
|
#212
Poor
84.1%
Bangladeshis
13.7
/100
|
#213
Poor
84.1%
Immigrants | Barbados
13.2
/100
|
#214
Poor
84.1%
Europeans
12.2
/100
|
#215
Poor
84.1%
Nicaraguans
12.1
/100
|
#216
Poor
84.1%
Immigrants | Norway
11.7
/100
|
#217
Poor
84.1%
Immigrants | Nicaragua
9.4
/100
|
#218
Tragic
84.1%
Sub-Saharan Africans
9.3
/100
|
#219
Tragic
84.1%
French
7.5
/100
|
#220
Tragic
84.0%
Icelanders
6.7
/100
|
#221
Tragic
84.0%
Assyrians/Chaldeans/Syriacs
6.6
/100
|
#222
Tragic
84.0%
Immigrants | Panama
6.4
/100
|
#223
Tragic
84.0%
U.S. Virgin Islanders
6.1
/100
|
#224
Tragic
84.0%