Immigrants from Senegal vs Nigerian In Labor Force | Age > 16
COMPARE
Immigrants from Senegal
Nigerian
In Labor Force | Age > 16
In Labor Force | Age > 16 Comparison
Immigrants from Senegal
Nigerians
66.4%
IN LABOR FORCE | AGE > 16
99.9/ 100
METRIC RATING
56th/ 347
METRIC RANK
66.6%
IN LABOR FORCE | AGE > 16
100.0/ 100
METRIC RATING
48th/ 347
METRIC RANK
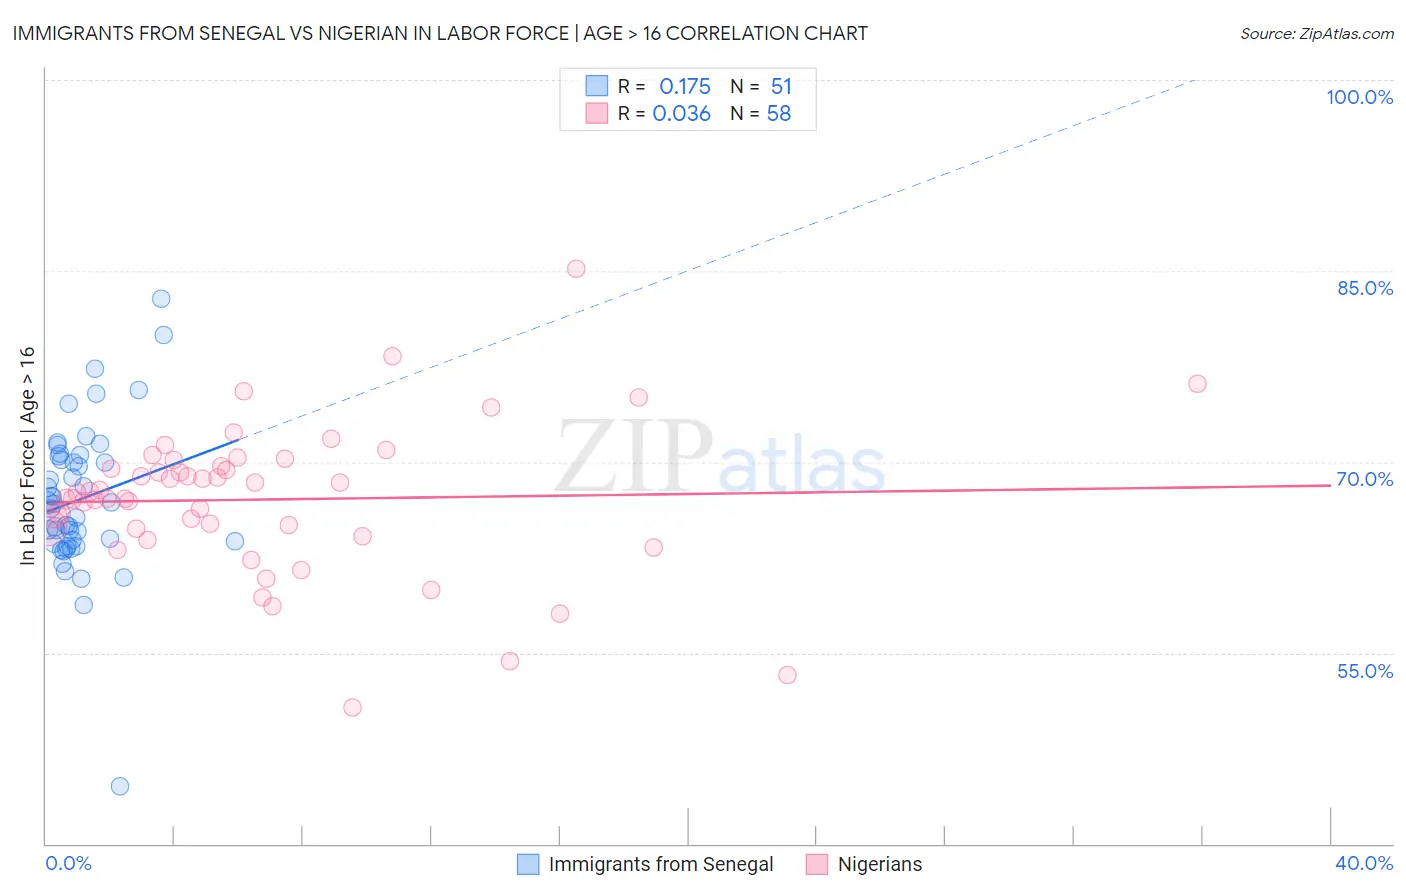
Immigrants from Senegal vs Nigerian In Labor Force | Age > 16 Correlation Chart
The statistical analysis conducted on geographies consisting of 90,129,295 people shows a poor positive correlation between the proportion of Immigrants from Senegal and labor force participation rate among population ages 16 and over in the United States with a correlation coefficient (R) of 0.175 and weighted average of 66.4%. Similarly, the statistical analysis conducted on geographies consisting of 332,792,636 people shows no correlation between the proportion of Nigerians and labor force participation rate among population ages 16 and over in the United States with a correlation coefficient (R) of 0.036 and weighted average of 66.6%, a difference of 0.30%.
In Labor Force | Age > 16 Correlation Summary
| Measurement | Immigrants from Senegal | Nigerian |
| Minimum | 44.5% | 50.7% |
| Maximum | 82.8% | 85.2% |
| Range | 38.3% | 34.5% |
| Mean | 67.1% | 67.0% |
| Median | 66.7% | 67.4% |
| Interquartile 25% (IQ1) | 63.6% | 64.7% |
| Interquartile 75% (IQ3) | 70.4% | 69.7% |
| Interquartile Range (IQR) | 6.9% | 4.9% |
| Standard Deviation (Sample) | 5.9% | 5.8% |
| Standard Deviation (Population) | 5.9% | 5.8% |
Demographics Similar to Immigrants from Senegal and Nigerians by In Labor Force | Age > 16
In terms of in labor force | age > 16, the demographic groups most similar to Immigrants from Senegal are Bulgarian (66.4%, a difference of 0.010%), Immigrants from Venezuela (66.4%, a difference of 0.030%), Immigrants from Bosnia and Herzegovina (66.5%, a difference of 0.080%), Immigrants from Sri Lanka (66.5%, a difference of 0.11%), and Immigrants from Saudi Arabia (66.3%, a difference of 0.11%). Similarly, the demographic groups most similar to Nigerians are Brazilian (66.6%, a difference of 0.010%), Immigrants from Bulgaria (66.6%, a difference of 0.010%), Immigrants from Northern Africa (66.6%, a difference of 0.020%), Cape Verdean (66.6%, a difference of 0.070%), and Immigrants from Brazil (66.7%, a difference of 0.080%).
| Demographics | Rating | Rank | In Labor Force | Age > 16 |
| Senegalese | 100.0 /100 | #42 | Exceptional 66.7% |
| Luxembourgers | 100.0 /100 | #43 | Exceptional 66.7% |
| Immigrants | Pakistan | 100.0 /100 | #44 | Exceptional 66.7% |
| Immigrants | Brazil | 100.0 /100 | #45 | Exceptional 66.7% |
| Brazilians | 100.0 /100 | #46 | Exceptional 66.6% |
| Immigrants | Bulgaria | 100.0 /100 | #47 | Exceptional 66.6% |
| Nigerians | 100.0 /100 | #48 | Exceptional 66.6% |
| Immigrants | Northern Africa | 100.0 /100 | #49 | Exceptional 66.6% |
| Cape Verdeans | 100.0 /100 | #50 | Exceptional 66.6% |
| Immigrants | Kuwait | 100.0 /100 | #51 | Exceptional 66.5% |
| Paraguayans | 99.9 /100 | #52 | Exceptional 66.5% |
| Immigrants | Sri Lanka | 99.9 /100 | #53 | Exceptional 66.5% |
| Immigrants | Bosnia and Herzegovina | 99.9 /100 | #54 | Exceptional 66.5% |
| Immigrants | Venezuela | 99.9 /100 | #55 | Exceptional 66.4% |
| Immigrants | Senegal | 99.9 /100 | #56 | Exceptional 66.4% |
| Bulgarians | 99.9 /100 | #57 | Exceptional 66.4% |
| Immigrants | Saudi Arabia | 99.9 /100 | #58 | Exceptional 66.3% |
| Immigrants | Turkey | 99.9 /100 | #59 | Exceptional 66.3% |
| Immigrants | Peru | 99.8 /100 | #60 | Exceptional 66.3% |
| Immigrants | Burma/Myanmar | 99.8 /100 | #61 | Exceptional 66.3% |
| Indonesians | 99.8 /100 | #62 | Exceptional 66.3% |