Immigrants from Scotland vs Immigrants from Southern Europe In Labor Force | Age 16-19

COMPARE

Immigrants from Scotland
Race
Ancestry
AfghanAfricanAlaska NativeAlaskan AthabascanAlbanianAleutAlsatianAmericanApacheArabArapahoArgentineanArmenianAssyrian/Chaldean/SyriacAustralianAustrianBahamianBangladeshiBarbadianBasqueBelgianBelizeanBermudanBhutaneseBlackfeetBolivianBrazilianBritishBritish West IndianBulgarianBurmeseCajunCambodianCanadianCape VerdeanCarpatho RusynCelticCentral AmericanCentral American IndianCherokeeCheyenneChickasawChileanChineseChippewaChoctawColombianColvilleComancheCosta RicanCreeCreekCroatianCrowCubanCypriotCzechCzechoslovakianDanishDelawareDominicanDutchDutch West IndianEastern EuropeanEcuadorianEgyptianEnglishEstonianEthiopianEuropeanFijianFilipinoFinnishFrenchFrench American IndianFrench CanadianGermanGerman RussianGhanaianGreekGuamanian/ChamorroGuatemalanGuyaneseHaitianHmongHonduranHopiHoumaHungarianIcelanderIndian (Asian)IndonesianInupiatIranianIraqiIrishIroquoisIsraeliItalianJamaicanJapaneseJordanianKenyanKiowaKoreanLaotianLatvianLebaneseLiberianLithuanianLumbeeLuxembourgerMacedonianMalaysianMalteseMarshalleseMenomineeMexicanMexican American IndianMongolianMoroccanNative HawaiianNavajoNepaleseNew ZealanderNicaraguanNigerianNorthern EuropeanNorwegianOkinawanOsageOttawaPaiutePakistaniPalestinianPanamanianParaguayanPennsylvania GermanPeruvianPimaPolishPortuguesePotawatomiPuebloPuerto RicanPuget Sound SalishRomanianRussianSalvadoranSamoanScandinavianScotch-IrishScottishSeminoleSenegaleseSerbianShoshoneSierra LeoneanSiouxSlavicSlovakSloveneSomaliSouth AfricanSouth AmericanSouth American IndianSoviet UnionSpaniardSpanishSpanish AmericanSpanish American IndianSri LankanSubsaharan AfricanSudaneseSwedishSwissSyrianTaiwaneseThaiTlingit-HaidaTohono O'OdhamTonganTrinidadian and TobagonianTsimshianTurkishU.S. Virgin IslanderUgandanUkrainianUruguayanUteVenezuelanVietnameseWelshWest IndianYakamaYaquiYugoslavianYumanYup'ikZimbabwean
Immigration
NonimmigrantsImmigrantsAfghanistanAfricaAlbaniaArgentinaArmeniaAsiaAustraliaAustriaBahamasBangladeshBarbadosBelarusBelgiumBelizeBoliviaBosnia and HerzegovinaBrazilBulgariaBurma/MyanmarCabo VerdeCambodiaCameroonCanadaCaribbeanCentral AmericaChileChinaColombiaCongoCosta RicaCroatiaCubaCzechoslovakiaDenmarkDominicaDominican RepublicEastern AfricaEastern AsiaEastern EuropeEcuadorEgyptEl SalvadorEnglandEritreaEthiopiaEuropeFijiFranceGermanyGhanaGreeceGrenadaGuatemalaGuyanaHaitiHondurasHong KongHungaryIndiaIndonesiaIranIraqIrelandIsraelItalyJamaicaJapanJordanKazakhstanKenyaKoreaKuwaitLaosLatin AmericaLatviaLebanonLiberiaLithuaniaMalaysiaMexicoMicronesiaMiddle AfricaMoldovaMoroccoNepalNetherlandsNicaraguaNigeriaNorth AmericaNorth MacedoniaNorthern AfricaNorthern EuropeNorwayOceaniaPakistanPanamaPeruPhilippinesPolandPortugalRomaniaRussiaSaudi ArabiaScotlandSenegalSerbiaSierra LeoneSingaporeSomaliaSouth AfricaSouth AmericaSouth Central AsiaSouth Eastern AsiaSpainSri LankaSt. Vincent and the GrenadinesSudanSwedenSwitzerlandSyriaTaiwanThailandTrinidad and TobagoTurkeyUgandaUkraineUruguayUzbekistanVenezuelaVietnamWest IndiesWestern AfricaWestern AsiaWestern EuropeYemenZaireZimbabweAzores
Immigrants from Southern Europe
Race
Ancestry
AfghanAfricanAlaska NativeAlaskan AthabascanAlbanianAleutAlsatianAmericanApacheArabArapahoArgentineanArmenianAssyrian/Chaldean/SyriacAustralianAustrianBahamianBangladeshiBarbadianBasqueBelgianBelizeanBermudanBhutaneseBlackfeetBolivianBrazilianBritishBritish West IndianBulgarianBurmeseCajunCambodianCanadianCape VerdeanCarpatho RusynCelticCentral AmericanCentral American IndianCherokeeCheyenneChickasawChileanChineseChippewaChoctawColombianColvilleComancheCosta RicanCreeCreekCroatianCrowCubanCypriotCzechCzechoslovakianDanishDelawareDominicanDutchDutch West IndianEastern EuropeanEcuadorianEgyptianEnglishEstonianEthiopianEuropeanFijianFilipinoFinnishFrenchFrench American IndianFrench CanadianGermanGerman RussianGhanaianGreekGuamanian/ChamorroGuatemalanGuyaneseHaitianHmongHonduranHopiHoumaHungarianIcelanderIndian (Asian)IndonesianInupiatIranianIraqiIrishIroquoisIsraeliItalianJamaicanJapaneseJordanianKenyanKiowaKoreanLaotianLatvianLebaneseLiberianLithuanianLumbeeLuxembourgerMacedonianMalaysianMalteseMarshalleseMenomineeMexicanMexican American IndianMongolianMoroccanNative HawaiianNavajoNepaleseNew ZealanderNicaraguanNigerianNorthern EuropeanNorwegianOkinawanOsageOttawaPaiutePakistaniPalestinianPanamanianParaguayanPennsylvania GermanPeruvianPimaPolishPortuguesePotawatomiPuebloPuerto RicanPuget Sound SalishRomanianRussianSalvadoranSamoanScandinavianScotch-IrishScottishSeminoleSenegaleseSerbianShoshoneSierra LeoneanSiouxSlavicSlovakSloveneSomaliSouth AfricanSouth AmericanSouth American IndianSoviet UnionSpaniardSpanishSpanish AmericanSpanish American IndianSri LankanSubsaharan AfricanSudaneseSwedishSwissSyrianTaiwaneseThaiTlingit-HaidaTohono O'OdhamTonganTrinidadian and TobagonianTsimshianTurkishU.S. Virgin IslanderUgandanUkrainianUruguayanUteVenezuelanVietnameseWelshWest IndianYakamaYaquiYugoslavianYumanYup'ikZimbabwean
Immigration
NonimmigrantsImmigrantsAfghanistanAfricaAlbaniaArgentinaArmeniaAsiaAustraliaAustriaBahamasBangladeshBarbadosBelarusBelgiumBelizeBoliviaBosnia and HerzegovinaBrazilBulgariaBurma/MyanmarCabo VerdeCambodiaCameroonCanadaCaribbeanCentral AmericaChileChinaColombiaCongoCosta RicaCroatiaCubaCzechoslovakiaDenmarkDominicaDominican RepublicEastern AfricaEastern AsiaEastern EuropeEcuadorEgyptEl SalvadorEnglandEritreaEthiopiaEuropeFijiFranceGermanyGhanaGreeceGrenadaGuatemalaGuyanaHaitiHondurasHong KongHungaryIndiaIndonesiaIranIraqIrelandIsraelItalyJamaicaJapanJordanKazakhstanKenyaKoreaKuwaitLaosLatin AmericaLatviaLebanonLiberiaLithuaniaMalaysiaMexicoMicronesiaMiddle AfricaMoldovaMoroccoNepalNetherlandsNicaraguaNigeriaNorth AmericaNorth MacedoniaNorthern AfricaNorthern EuropeNorwayOceaniaPakistanPanamaPeruPhilippinesPolandPortugalRomaniaRussiaSaudi ArabiaSenegalSerbiaSierra LeoneSingaporeSomaliaSouth AfricaSouth AmericaSouth Central AsiaSouth Eastern AsiaSouthern EuropeSpainSri LankaSt. Vincent and the GrenadinesSudanSwedenSwitzerlandSyriaTaiwanThailandTrinidad and TobagoTurkeyUgandaUkraineUruguayUzbekistanVenezuelaVietnamWest IndiesWestern AfricaWestern AsiaWestern EuropeYemenZaireZimbabweAzores
In Labor Force | Age 16-19
Income
Poverty
Unemployment
Labor Participation
Family Structure
Vehicle Availability
Education Level
Disability

In Labor Force | Age 16-19 Comparison

Immigrants from Scotland

Immigrants from Southern Europe

Exceptional
Average
38.5%
IN LABOR FORCE | AGE 16-19
98.5/ 100
METRIC RATING
112th/ 347
METRIC RANK
36.4%
IN LABOR FORCE | AGE 16-19
43.3/ 100
METRIC RATING
179th/ 347
METRIC RANK

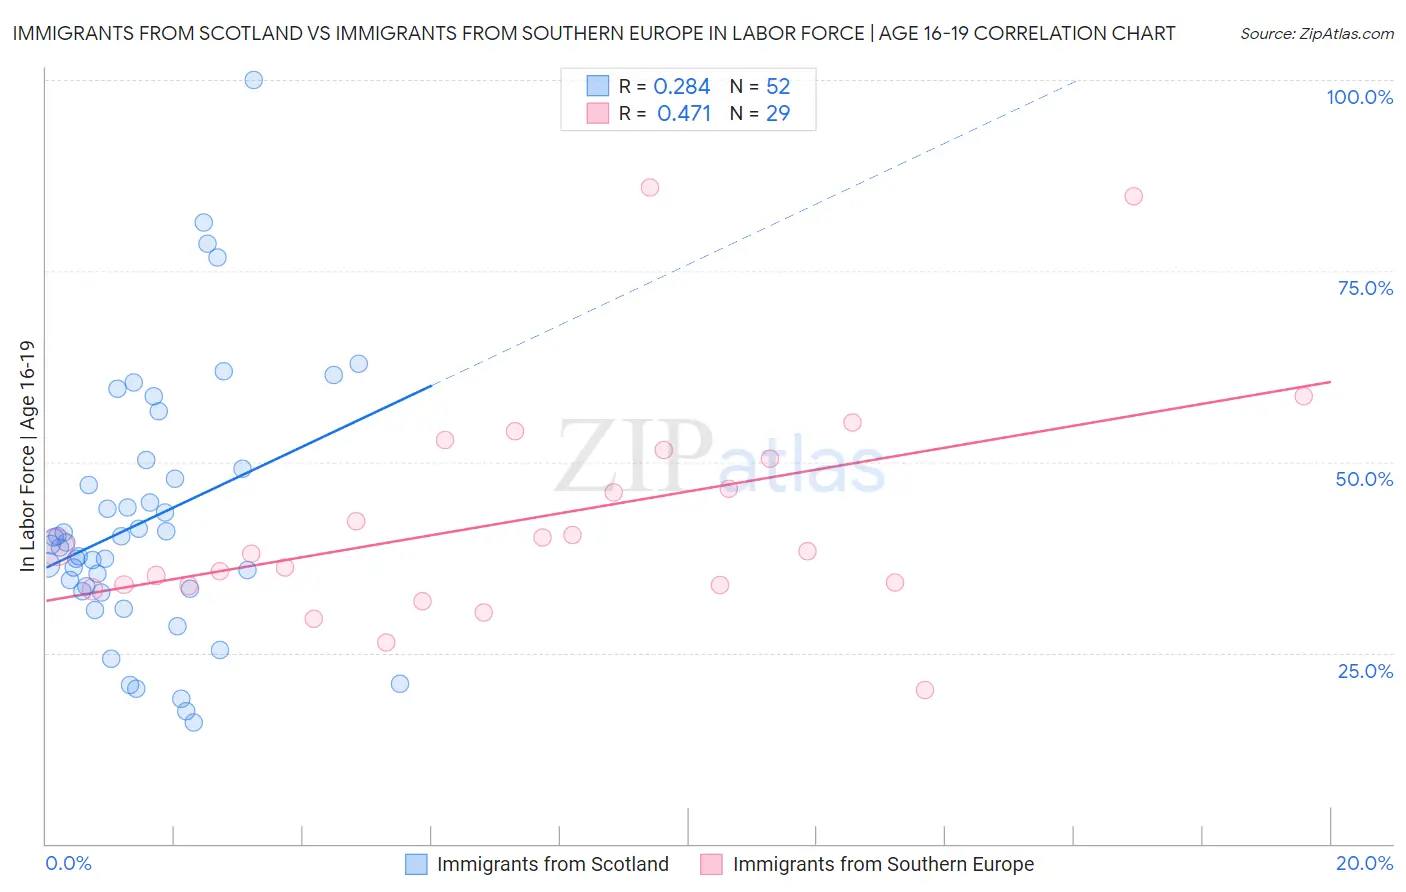
Immigrants from Scotland vs Immigrants from Southern Europe In Labor Force | Age 16-19 Correlation Chart

The statistical analysis conducted on geographies consisting of 196,210,607 people shows a weak positive correlation between the proportion of Immigrants from Scotland and labor force participation rate among population between the ages 16 and 19 in the United States with a correlation coefficient (R) of 0.284 and weighted average of 38.5%. Similarly, the statistical analysis conducted on geographies consisting of 401,923,668 people shows a moderate positive correlation between the proportion of Immigrants from Southern Europe and labor force participation rate among population between the ages 16 and 19 in the United States with a correlation coefficient (R) of 0.471 and weighted average of 36.4%, a difference of 5.6%.
Immigrants from Scotland vs Immigrants from Southern Europe In Labor Force | Age 16-19

In Labor Force | Age 16-19 Correlation Summary

MeasurementImmigrants from ScotlandImmigrants from Southern Europe
Minimum15.9%20.1%
Maximum100.0%85.9%
Range84.1%65.8%
Mean42.4%42.7%
Median39.3%38.4%
Interquartile 25% (IQ1)33.2%33.9%
Interquartile 75% (IQ3)48.5%51.0%
Interquartile Range (IQR)15.3%17.1%
Standard Deviation (Sample)17.1%15.0%
Standard Deviation (Population)16.9%14.7%

Similar Demographics by In Labor Force | Age 16-19

Demographics Similar to Immigrants from Scotland by In Labor Force | Age 16-19

In terms of in labor force | age 16-19, the demographic groups most similar to Immigrants from Scotland are Crow (38.5%, a difference of 0.010%), Maltese (38.5%, a difference of 0.070%), Subsaharan African (38.4%, a difference of 0.13%), Lebanese (38.6%, a difference of 0.19%), and Immigrants from Ethiopia (38.6%, a difference of 0.20%).
DemographicsRating | RankIn Labor Force | Age 16-19
Iraqis
98.9
/100
|
#105
Exceptional
38.6%
Delaware
98.8
/100
|
#106
Exceptional
38.6%
Chinese
98.8
/100
|
#107
Exceptional
38.6%
Immigrants | Ethiopia
98.7
/100
|
#108
Exceptional
38.6%
Lebanese
98.7
/100
|
#109
Exceptional
38.6%
Maltese
98.6
/100
|
#110
Exceptional
38.5%
Crow
98.5
/100
|
#111
Exceptional
38.5%
Immigrants | Scotland
98.5
/100
|
#112
Exceptional
38.5%
Sub-Saharan Africans
98.3
/100
|
#113
Exceptional
38.4%
Hawaiians
98.2
/100
|
#114
Exceptional
38.4%
Bulgarians
97.9
/100
|
#115
Exceptional
38.3%
Colville
97.9
/100
|
#116
Exceptional
38.3%
Chickasaw
97.8
/100
|
#117
Exceptional
38.3%
Immigrants | Nepal
97.8
/100
|
#118
Exceptional
38.3%
Assyrians/Chaldeans/Syriacs
97.8
/100
|
#119
Exceptional
38.3%

Demographics Similar to Immigrants from Southern Europe by In Labor Force | Age 16-19

In terms of in labor force | age 16-19, the demographic groups most similar to Immigrants from Southern Europe are Black/African American (36.5%, a difference of 0.090%), Immigrants from Morocco (36.4%, a difference of 0.12%), Immigrants from Northern Europe (36.5%, a difference of 0.17%), Jordanian (36.4%, a difference of 0.20%), and Immigrants from Italy (36.4%, a difference of 0.22%).
DemographicsRating | RankIn Labor Force | Age 16-19
South Africans
58.3
/100
|
#172
Average
36.7%
Russians
57.5
/100
|
#173
Average
36.7%
Immigrants | Czechoslovakia
50.0
/100
|
#174
Average
36.6%
Natives/Alaskans
49.0
/100
|
#175
Average
36.6%
Albanians
48.8
/100
|
#176
Average
36.5%
Immigrants | Northern Europe
46.6
/100
|
#177
Average
36.5%
Blacks/African Americans
45.1
/100
|
#178
Average
36.5%
Immigrants | Southern Europe
43.3
/100
|
#179
Average
36.4%
Immigrants | Morocco
41.1
/100
|
#180
Average
36.4%
Jordanians
39.6
/100
|
#181
Fair
36.4%
Immigrants | Italy
39.1
/100
|
#182
Fair
36.4%
Eastern Europeans
38.8
/100
|
#183
Fair
36.4%
Costa Ricans
36.1
/100
|
#184
Fair
36.3%
Bhutanese
35.3
/100
|
#185
Fair
36.3%
Immigrants | Romania
34.0
/100
|
#186
Fair
36.3%