Immigrants from Russia vs Danish In Labor Force | Age 30-34

COMPARE

Immigrants from Russia
Race
Ancestry
AfghanAfricanAlaska NativeAlaskan AthabascanAlbanianAleutAlsatianAmericanApacheArabArapahoArgentineanArmenianAssyrian/Chaldean/SyriacAustralianAustrianBahamianBangladeshiBarbadianBasqueBelgianBelizeanBermudanBhutaneseBlackfeetBolivianBrazilianBritishBritish West IndianBulgarianBurmeseCajunCambodianCanadianCape VerdeanCarpatho RusynCelticCentral AmericanCentral American IndianCherokeeCheyenneChickasawChileanChineseChippewaChoctawColombianColvilleComancheCosta RicanCreeCreekCroatianCrowCubanCypriotCzechCzechoslovakianDelawareDominicanDutchDutch West IndianEastern EuropeanEcuadorianEgyptianEnglishEstonianEthiopianEuropeanFijianFilipinoFinnishFrenchFrench American IndianFrench CanadianGermanGerman RussianGhanaianGreekGuamanian/ChamorroGuatemalanGuyaneseHaitianHmongHonduranHopiHoumaHungarianIcelanderIndian (Asian)IndonesianInupiatIranianIraqiIrishIroquoisIsraeliItalianJamaicanJapaneseJordanianKenyanKiowaKoreanLaotianLatvianLebaneseLiberianLithuanianLumbeeLuxembourgerMacedonianMalaysianMalteseMarshalleseMenomineeMexicanMexican American IndianMongolianMoroccanNative HawaiianNavajoNepaleseNew ZealanderNicaraguanNigerianNorthern EuropeanNorwegianOkinawanOsageOttawaPaiutePakistaniPalestinianPanamanianParaguayanPennsylvania GermanPeruvianPimaPolishPortuguesePotawatomiPuebloPuerto RicanPuget Sound SalishRomanianRussianSalvadoranSamoanScandinavianScotch-IrishScottishSeminoleSenegaleseSerbianShoshoneSierra LeoneanSiouxSlavicSlovakSloveneSomaliSouth AfricanSouth AmericanSouth American IndianSoviet UnionSpaniardSpanishSpanish AmericanSpanish American IndianSri LankanSubsaharan AfricanSudaneseSwedishSwissSyrianTaiwaneseThaiTlingit-HaidaTohono O'OdhamTonganTrinidadian and TobagonianTsimshianTurkishU.S. Virgin IslanderUgandanUkrainianUruguayanUteVenezuelanVietnameseWelshWest IndianYakamaYaquiYugoslavianYumanYup'ikZimbabwean
Immigration
NonimmigrantsImmigrantsAfghanistanAfricaAlbaniaArgentinaArmeniaAsiaAustraliaAustriaBahamasBangladeshBarbadosBelarusBelgiumBelizeBoliviaBosnia and HerzegovinaBrazilBulgariaBurma/MyanmarCabo VerdeCambodiaCameroonCanadaCaribbeanCentral AmericaChileChinaColombiaCongoCosta RicaCroatiaCubaCzechoslovakiaDenmarkDominicaDominican RepublicEastern AfricaEastern AsiaEastern EuropeEcuadorEgyptEl SalvadorEnglandEritreaEthiopiaEuropeFijiFranceGermanyGhanaGreeceGrenadaGuatemalaGuyanaHaitiHondurasHong KongHungaryIndiaIndonesiaIranIraqIrelandIsraelItalyJamaicaJapanJordanKazakhstanKenyaKoreaKuwaitLaosLatin AmericaLatviaLebanonLiberiaLithuaniaMalaysiaMexicoMicronesiaMiddle AfricaMoldovaMoroccoNepalNetherlandsNicaraguaNigeriaNorth AmericaNorth MacedoniaNorthern AfricaNorthern EuropeNorwayOceaniaPakistanPanamaPeruPhilippinesPolandPortugalRomaniaRussiaSaudi ArabiaScotlandSenegalSerbiaSierra LeoneSingaporeSomaliaSouth AfricaSouth AmericaSouth Central AsiaSouth Eastern AsiaSouthern EuropeSpainSri LankaSt. Vincent and the GrenadinesSudanSwedenSwitzerlandSyriaTaiwanThailandTrinidad and TobagoTurkeyUgandaUkraineUruguayUzbekistanVenezuelaVietnamWest IndiesWestern AfricaWestern AsiaWestern EuropeYemenZaireZimbabweAzores
Danish
Race
Ancestry
AfghanAfricanAlaska NativeAlaskan AthabascanAlbanianAleutAlsatianAmericanApacheArabArapahoArgentineanArmenianAssyrian/Chaldean/SyriacAustralianAustrianBahamianBangladeshiBarbadianBasqueBelgianBelizeanBermudanBhutaneseBlackfeetBolivianBrazilianBritishBritish West IndianBulgarianBurmeseCajunCambodianCanadianCape VerdeanCarpatho RusynCelticCentral AmericanCentral American IndianCherokeeCheyenneChickasawChileanChineseChippewaChoctawColombianColvilleComancheCosta RicanCreeCreekCroatianCrowCubanCypriotCzechCzechoslovakianDanishDelawareDominicanDutchDutch West IndianEastern EuropeanEcuadorianEgyptianEnglishEstonianEthiopianEuropeanFijianFilipinoFinnishFrenchFrench American IndianFrench CanadianGermanGerman RussianGhanaianGreekGuamanian/ChamorroGuatemalanGuyaneseHaitianHmongHonduranHopiHoumaHungarianIcelanderIndian (Asian)IndonesianInupiatIranianIraqiIrishIroquoisIsraeliItalianJamaicanJapaneseJordanianKenyanKiowaKoreanLaotianLatvianLebaneseLiberianLithuanianLumbeeLuxembourgerMacedonianMalaysianMalteseMarshalleseMenomineeMexicanMexican American IndianMongolianMoroccanNative HawaiianNavajoNepaleseNew ZealanderNicaraguanNigerianNorthern EuropeanNorwegianOkinawanOsageOttawaPaiutePakistaniPalestinianPanamanianParaguayanPennsylvania GermanPeruvianPimaPolishPortuguesePotawatomiPuebloPuerto RicanPuget Sound SalishRomanianRussianSalvadoranSamoanScandinavianScotch-IrishScottishSeminoleSenegaleseSerbianShoshoneSierra LeoneanSiouxSlavicSlovakSloveneSomaliSouth AfricanSouth AmericanSouth American IndianSoviet UnionSpaniardSpanishSpanish AmericanSpanish American IndianSri LankanSubsaharan AfricanSudaneseSwedishSwissSyrianTaiwaneseThaiTlingit-HaidaTohono O'OdhamTonganTrinidadian and TobagonianTsimshianTurkishU.S. Virgin IslanderUgandanUkrainianUruguayanUteVenezuelanVietnameseWelshWest IndianYakamaYaquiYugoslavianYumanYup'ikZimbabwean
Immigration
NonimmigrantsImmigrantsAfghanistanAfricaAlbaniaArgentinaArmeniaAsiaAustraliaAustriaBahamasBangladeshBarbadosBelarusBelgiumBelizeBoliviaBosnia and HerzegovinaBrazilBulgariaBurma/MyanmarCabo VerdeCambodiaCameroonCanadaCaribbeanCentral AmericaChileChinaColombiaCongoCosta RicaCroatiaCubaCzechoslovakiaDenmarkDominicaDominican RepublicEastern AfricaEastern AsiaEastern EuropeEcuadorEgyptEl SalvadorEnglandEritreaEthiopiaEuropeFijiFranceGermanyGhanaGreeceGrenadaGuatemalaGuyanaHaitiHondurasHong KongHungaryIndiaIndonesiaIranIraqIrelandIsraelItalyJamaicaJapanJordanKazakhstanKenyaKoreaKuwaitLaosLatin AmericaLatviaLebanonLiberiaLithuaniaMalaysiaMexicoMicronesiaMiddle AfricaMoldovaMoroccoNepalNetherlandsNicaraguaNigeriaNorth AmericaNorth MacedoniaNorthern AfricaNorthern EuropeNorwayOceaniaPakistanPanamaPeruPhilippinesPolandPortugalRomaniaSaudi ArabiaScotlandSenegalSerbiaSierra LeoneSingaporeSomaliaSouth AfricaSouth AmericaSouth Central AsiaSouth Eastern AsiaSouthern EuropeSpainSri LankaSt. Vincent and the GrenadinesSudanSwedenSwitzerlandSyriaTaiwanThailandTrinidad and TobagoTurkeyUgandaUkraineUruguayUzbekistanVenezuelaVietnamWest IndiesWestern AfricaWestern AsiaWestern EuropeYemenZaireZimbabweAzores
In Labor Force | Age 30-34
Income
Poverty
Unemployment
Labor Participation
Family Structure
Vehicle Availability
Education Level
Disability

In Labor Force | Age 30-34 Comparison

Immigrants from Russia

Danes

Exceptional
Tragic
85.3%
IN LABOR FORCE | AGE 30-34
98.7/ 100
METRIC RATING
80th/ 347
METRIC RANK
84.3%
IN LABOR FORCE | AGE 30-34
5.3/ 100
METRIC RATING
220th/ 347
METRIC RANK

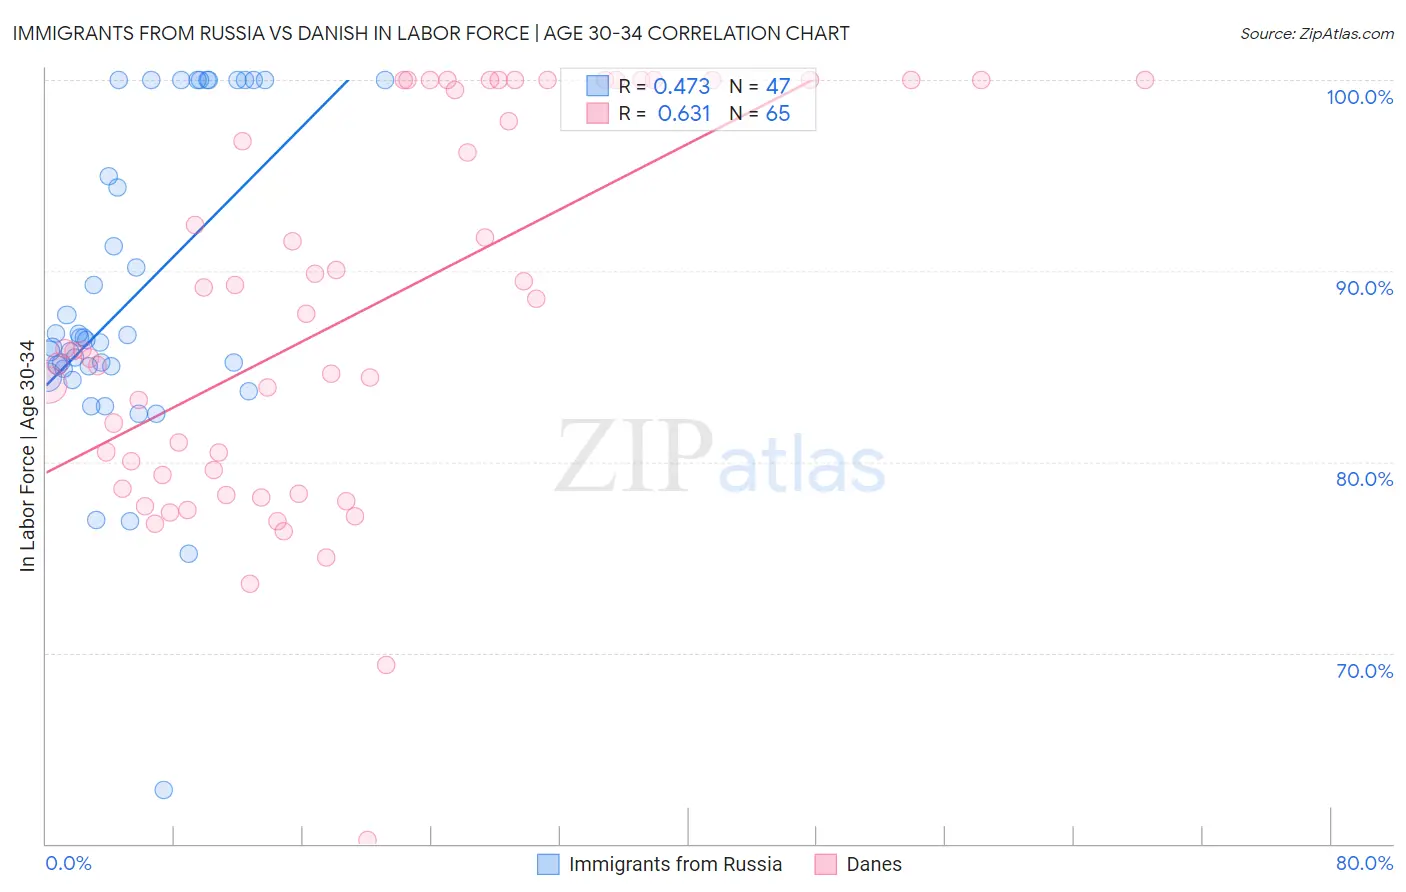
Immigrants from Russia vs Danish In Labor Force | Age 30-34 Correlation Chart

The statistical analysis conducted on geographies consisting of 347,731,999 people shows a moderate positive correlation between the proportion of Immigrants from Russia and labor force participation rate among population between the ages 30 and 34 in the United States with a correlation coefficient (R) of 0.473 and weighted average of 85.3%. Similarly, the statistical analysis conducted on geographies consisting of 473,662,566 people shows a significant positive correlation between the proportion of Danes and labor force participation rate among population between the ages 30 and 34 in the United States with a correlation coefficient (R) of 0.631 and weighted average of 84.3%, a difference of 1.3%.
Immigrants from Russia vs Danish In Labor Force | Age 30-34

In Labor Force | Age 30-34 Correlation Summary

MeasurementImmigrants from RussiaDanish
Minimum62.8%60.2%
Maximum100.0%100.0%
Range37.2%39.8%
Mean88.7%87.6%
Median86.4%85.8%
Interquartile 25% (IQ1)84.9%79.0%
Interquartile 75% (IQ3)100.0%100.0%
Interquartile Range (IQR)15.1%21.0%
Standard Deviation (Sample)8.2%9.8%
Standard Deviation (Population)8.1%9.8%

Similar Demographics by In Labor Force | Age 30-34

Demographics Similar to Immigrants from Russia by In Labor Force | Age 30-34

In terms of in labor force | age 30-34, the demographic groups most similar to Immigrants from Russia are Immigrants from Switzerland (85.3%, a difference of 0.0%), Immigrants from Singapore (85.3%, a difference of 0.010%), Slovak (85.3%, a difference of 0.010%), Immigrants from Africa (85.3%, a difference of 0.010%), and Immigrants from Europe (85.3%, a difference of 0.020%).
DemographicsRating | RankIn Labor Force | Age 30-34
Indians (Asian)
99.0
/100
|
#73
Exceptional
85.4%
Maltese
99.0
/100
|
#74
Exceptional
85.4%
Immigrants | Czechoslovakia
99.0
/100
|
#75
Exceptional
85.4%
Iranians
99.0
/100
|
#76
Exceptional
85.4%
Immigrants | Eastern Asia
98.9
/100
|
#77
Exceptional
85.4%
Immigrants | Singapore
98.8
/100
|
#78
Exceptional
85.3%
Immigrants | Switzerland
98.7
/100
|
#79
Exceptional
85.3%
Immigrants | Russia
98.7
/100
|
#80
Exceptional
85.3%
Slovaks
98.7
/100
|
#81
Exceptional
85.3%
Immigrants | Africa
98.6
/100
|
#82
Exceptional
85.3%
Immigrants | Europe
98.6
/100
|
#83
Exceptional
85.3%
Greeks
98.6
/100
|
#84
Exceptional
85.3%
Mongolians
98.5
/100
|
#85
Exceptional
85.3%
Immigrants | Taiwan
98.3
/100
|
#86
Exceptional
85.3%
Immigrants | Northern Europe
98.2
/100
|
#87
Exceptional
85.3%

Demographics Similar to Danes by In Labor Force | Age 30-34

In terms of in labor force | age 30-34, the demographic groups most similar to Danes are Swiss (84.3%, a difference of 0.020%), Immigrants from Panama (84.3%, a difference of 0.030%), Immigrants from Trinidad and Tobago (84.3%, a difference of 0.050%), Immigrants from Germany (84.3%, a difference of 0.060%), and European (84.3%, a difference of 0.060%).
DemographicsRating | RankIn Labor Force | Age 30-34
Immigrants | Jamaica
7.9
/100
|
#213
Tragic
84.3%
Immigrants | Germany
7.2
/100
|
#214
Tragic
84.3%
Europeans
7.2
/100
|
#215
Tragic
84.3%
Immigrants | Ecuador
7.1
/100
|
#216
Tragic
84.3%
Immigrants | Trinidad and Tobago
7.0
/100
|
#217
Tragic
84.3%
Immigrants | Panama
6.3
/100
|
#218
Tragic
84.3%
Swiss
5.8
/100
|
#219
Tragic
84.3%
Danes
5.3
/100
|
#220
Tragic
84.3%
Salvadorans
3.8
/100
|
#221
Tragic
84.2%
Panamanians
3.8
/100
|
#222
Tragic
84.2%
Immigrants | Laos
3.6
/100
|
#223
Tragic
84.2%
Cubans
3.4
/100
|
#224
Tragic
84.2%
Scottish
3.1
/100
|
#225
Tragic
84.2%
Immigrants | El Salvador
3.0
/100
|
#226
Tragic
84.2%
Immigrants | Cuba
3.0
/100
|
#227
Tragic
84.2%