Immigrants from Philippines vs Spanish In Labor Force | Age 30-34
COMPARE
Immigrants from Philippines
Spanish
In Labor Force | Age 30-34
In Labor Force | Age 30-34 Comparison
Immigrants from Philippines
Spanish
84.6%
IN LABOR FORCE | AGE 30-34
31.5/ 100
METRIC RATING
185th/ 347
METRIC RANK
83.5%
IN LABOR FORCE | AGE 30-34
0.0/ 100
METRIC RATING
271st/ 347
METRIC RANK
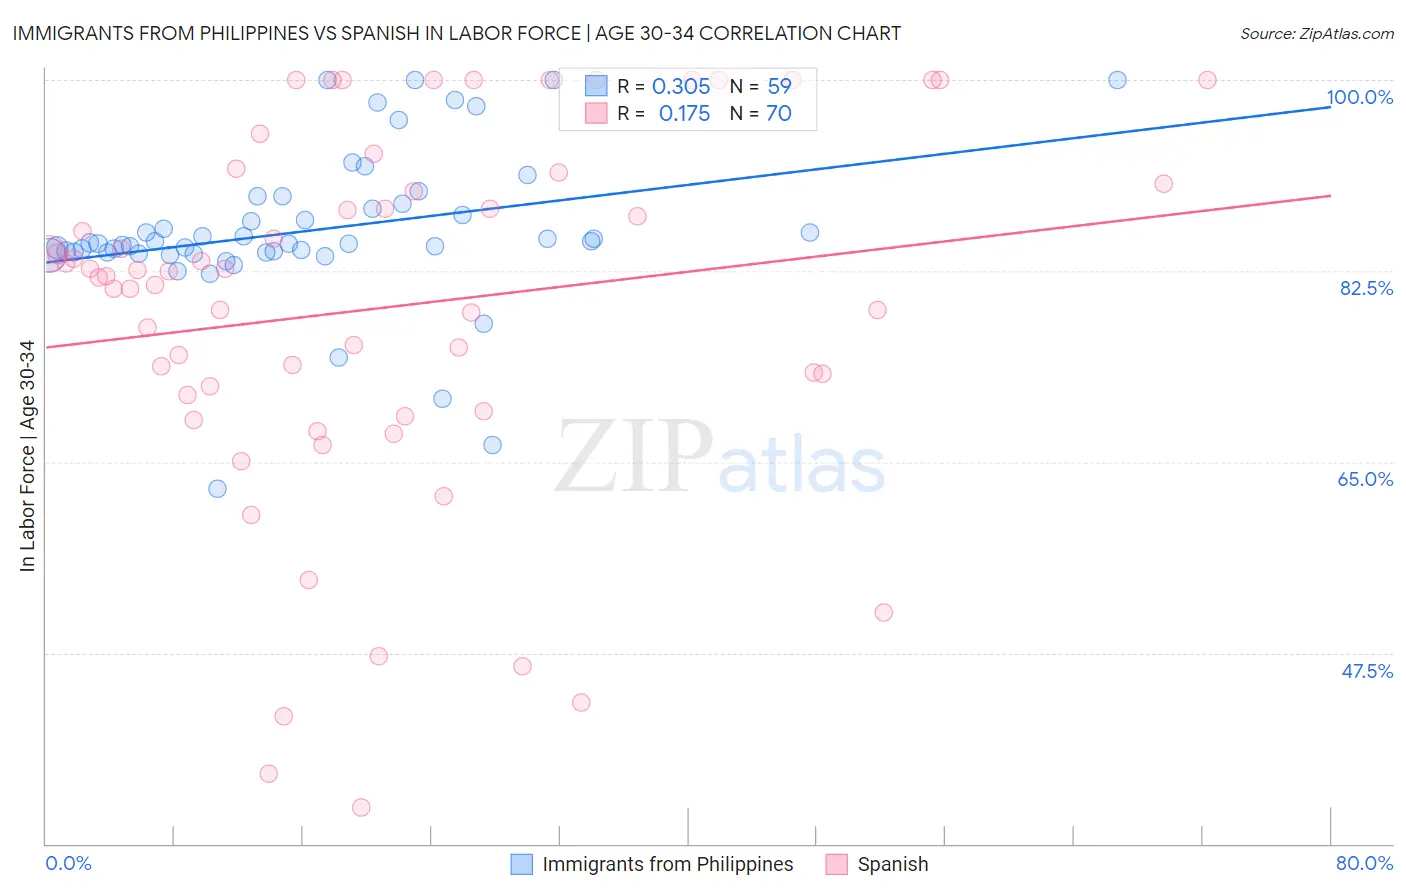
Immigrants from Philippines vs Spanish In Labor Force | Age 30-34 Correlation Chart
The statistical analysis conducted on geographies consisting of 471,048,330 people shows a mild positive correlation between the proportion of Immigrants from Philippines and labor force participation rate among population between the ages 30 and 34 in the United States with a correlation coefficient (R) of 0.305 and weighted average of 84.6%. Similarly, the statistical analysis conducted on geographies consisting of 421,842,107 people shows a poor positive correlation between the proportion of Spanish and labor force participation rate among population between the ages 30 and 34 in the United States with a correlation coefficient (R) of 0.175 and weighted average of 83.5%, a difference of 1.2%.
In Labor Force | Age 30-34 Correlation Summary
| Measurement | Immigrants from Philippines | Spanish |
| Minimum | 62.5% | 33.3% |
| Maximum | 100.0% | 100.0% |
| Range | 37.5% | 66.7% |
| Mean | 86.2% | 79.2% |
| Median | 85.0% | 82.2% |
| Interquartile 25% (IQ1) | 84.2% | 71.1% |
| Interquartile 75% (IQ3) | 88.7% | 90.5% |
| Interquartile Range (IQR) | 4.5% | 19.4% |
| Standard Deviation (Sample) | 7.1% | 16.7% |
| Standard Deviation (Population) | 7.1% | 16.6% |
Similar Demographics by In Labor Force | Age 30-34
Demographics Similar to Immigrants from Philippines by In Labor Force | Age 30-34
In terms of in labor force | age 30-34, the demographic groups most similar to Immigrants from Philippines are Immigrants from North America (84.6%, a difference of 0.010%), Immigrants from Congo (84.6%, a difference of 0.010%), Costa Rican (84.6%, a difference of 0.020%), Taiwanese (84.6%, a difference of 0.020%), and Nigerian (84.5%, a difference of 0.020%).
| Demographics | Rating | Rank | In Labor Force | Age 30-34 |
| Okinawans | 44.1 /100 | #178 | Average 84.6% |
| Immigrants | Nigeria | 42.5 /100 | #179 | Average 84.6% |
| Immigrants | Netherlands | 42.1 /100 | #180 | Average 84.6% |
| Moroccans | 40.3 /100 | #181 | Average 84.6% |
| Barbadians | 36.7 /100 | #182 | Fair 84.6% |
| Immigrants | Canada | 35.0 /100 | #183 | Fair 84.6% |
| Immigrants | North America | 33.3 /100 | #184 | Fair 84.6% |
| Immigrants | Philippines | 31.5 /100 | #185 | Fair 84.6% |
| Immigrants | Congo | 29.7 /100 | #186 | Fair 84.6% |
| Costa Ricans | 29.6 /100 | #187 | Fair 84.6% |
| Taiwanese | 29.4 /100 | #188 | Fair 84.6% |
| Nigerians | 28.9 /100 | #189 | Fair 84.5% |
| Immigrants | Zaire | 25.8 /100 | #190 | Fair 84.5% |
| Hungarians | 24.8 /100 | #191 | Fair 84.5% |
| Scandinavians | 24.7 /100 | #192 | Fair 84.5% |
Demographics Similar to Spanish by In Labor Force | Age 30-34
In terms of in labor force | age 30-34, the demographic groups most similar to Spanish are Nonimmigrants (83.5%, a difference of 0.0%), Spanish American (83.5%, a difference of 0.020%), Guamanian/Chamorro (83.5%, a difference of 0.050%), Belizean (83.5%, a difference of 0.060%), and Vietnamese (83.6%, a difference of 0.070%).
| Demographics | Rating | Rank | In Labor Force | Age 30-34 |
| Guatemalans | 0.2 /100 | #264 | Tragic 83.7% |
| Immigrants | Honduras | 0.1 /100 | #265 | Tragic 83.7% |
| Immigrants | Guatemala | 0.1 /100 | #266 | Tragic 83.7% |
| Spaniards | 0.1 /100 | #267 | Tragic 83.6% |
| Immigrants | Bangladesh | 0.1 /100 | #268 | Tragic 83.6% |
| Vietnamese | 0.1 /100 | #269 | Tragic 83.6% |
| Spanish Americans | 0.0 /100 | #270 | Tragic 83.5% |
| Spanish | 0.0 /100 | #271 | Tragic 83.5% |
| Immigrants | Nonimmigrants | 0.0 /100 | #272 | Tragic 83.5% |
| Guamanians/Chamorros | 0.0 /100 | #273 | Tragic 83.5% |
| Belizeans | 0.0 /100 | #274 | Tragic 83.5% |
| Immigrants | Grenada | 0.0 /100 | #275 | Tragic 83.5% |
| Tongans | 0.0 /100 | #276 | Tragic 83.5% |
| Delaware | 0.0 /100 | #277 | Tragic 83.5% |
| Fijians | 0.0 /100 | #278 | Tragic 83.4% |