Immigrants from Pakistan vs Immigrants from Denmark In Labor Force | Age > 16

COMPARE

Immigrants from Pakistan
Race
Ancestry
AfghanAfricanAlaska NativeAlaskan AthabascanAlbanianAleutAlsatianAmericanApacheArabArapahoArgentineanArmenianAssyrian/Chaldean/SyriacAustralianAustrianBahamianBangladeshiBarbadianBasqueBelgianBelizeanBermudanBhutaneseBlackfeetBolivianBrazilianBritishBritish West IndianBulgarianBurmeseCajunCambodianCanadianCape VerdeanCarpatho RusynCelticCentral AmericanCentral American IndianCherokeeCheyenneChickasawChileanChineseChippewaChoctawColombianColvilleComancheCosta RicanCreeCreekCroatianCrowCubanCypriotCzechCzechoslovakianDanishDelawareDominicanDutchDutch West IndianEastern EuropeanEcuadorianEgyptianEnglishEstonianEthiopianEuropeanFijianFilipinoFinnishFrenchFrench American IndianFrench CanadianGermanGerman RussianGhanaianGreekGuamanian/ChamorroGuatemalanGuyaneseHaitianHmongHonduranHopiHoumaHungarianIcelanderIndian (Asian)IndonesianInupiatIranianIraqiIrishIroquoisIsraeliItalianJamaicanJapaneseJordanianKenyanKiowaKoreanLaotianLatvianLebaneseLiberianLithuanianLumbeeLuxembourgerMacedonianMalaysianMalteseMarshalleseMenomineeMexicanMexican American IndianMongolianMoroccanNative HawaiianNavajoNepaleseNew ZealanderNicaraguanNigerianNorthern EuropeanNorwegianOkinawanOsageOttawaPaiutePakistaniPalestinianPanamanianParaguayanPennsylvania GermanPeruvianPimaPolishPortuguesePotawatomiPuebloPuerto RicanPuget Sound SalishRomanianRussianSalvadoranSamoanScandinavianScotch-IrishScottishSeminoleSenegaleseSerbianShoshoneSierra LeoneanSiouxSlavicSlovakSloveneSomaliSouth AfricanSouth AmericanSouth American IndianSoviet UnionSpaniardSpanishSpanish AmericanSpanish American IndianSri LankanSubsaharan AfricanSudaneseSwedishSwissSyrianTaiwaneseThaiTlingit-HaidaTohono O'OdhamTonganTrinidadian and TobagonianTsimshianTurkishU.S. Virgin IslanderUgandanUkrainianUruguayanUteVenezuelanVietnameseWelshWest IndianYakamaYaquiYugoslavianYumanYup'ikZimbabwean
Immigration
NonimmigrantsImmigrantsAfghanistanAfricaAlbaniaArgentinaArmeniaAsiaAustraliaAustriaBahamasBangladeshBarbadosBelarusBelgiumBelizeBoliviaBosnia and HerzegovinaBrazilBulgariaBurma/MyanmarCabo VerdeCambodiaCameroonCanadaCaribbeanCentral AmericaChileChinaColombiaCongoCosta RicaCroatiaCubaCzechoslovakiaDominicaDominican RepublicEastern AfricaEastern AsiaEastern EuropeEcuadorEgyptEl SalvadorEnglandEritreaEthiopiaEuropeFijiFranceGermanyGhanaGreeceGrenadaGuatemalaGuyanaHaitiHondurasHong KongHungaryIndiaIndonesiaIranIraqIrelandIsraelItalyJamaicaJapanJordanKazakhstanKenyaKoreaKuwaitLaosLatin AmericaLatviaLebanonLiberiaLithuaniaMalaysiaMexicoMicronesiaMiddle AfricaMoldovaMoroccoNepalNetherlandsNicaraguaNigeriaNorth AmericaNorth MacedoniaNorthern AfricaNorthern EuropeNorwayOceaniaPakistanPanamaPeruPhilippinesPolandPortugalRomaniaRussiaSaudi ArabiaScotlandSenegalSerbiaSierra LeoneSingaporeSomaliaSouth AfricaSouth AmericaSouth Central AsiaSouth Eastern AsiaSouthern EuropeSpainSri LankaSt. Vincent and the GrenadinesSudanSwedenSwitzerlandSyriaTaiwanThailandTrinidad and TobagoTurkeyUgandaUkraineUruguayUzbekistanVenezuelaVietnamWest IndiesWestern AfricaWestern AsiaWestern EuropeYemenZaireZimbabweAzores
Immigrants from Denmark
Race
Ancestry
AfghanAfricanAlaska NativeAlaskan AthabascanAlbanianAleutAlsatianAmericanApacheArabArapahoArgentineanArmenianAssyrian/Chaldean/SyriacAustralianAustrianBahamianBangladeshiBarbadianBasqueBelgianBelizeanBermudanBhutaneseBlackfeetBolivianBrazilianBritishBritish West IndianBulgarianBurmeseCajunCambodianCanadianCape VerdeanCarpatho RusynCelticCentral AmericanCentral American IndianCherokeeCheyenneChickasawChileanChineseChippewaChoctawColombianColvilleComancheCosta RicanCreeCreekCroatianCrowCubanCypriotCzechCzechoslovakianDanishDelawareDominicanDutchDutch West IndianEastern EuropeanEcuadorianEgyptianEnglishEstonianEthiopianEuropeanFijianFilipinoFinnishFrenchFrench American IndianFrench CanadianGermanGerman RussianGhanaianGreekGuamanian/ChamorroGuatemalanGuyaneseHaitianHmongHonduranHopiHoumaHungarianIcelanderIndian (Asian)IndonesianInupiatIranianIraqiIrishIroquoisIsraeliItalianJamaicanJapaneseJordanianKenyanKiowaKoreanLaotianLatvianLebaneseLiberianLithuanianLumbeeLuxembourgerMacedonianMalaysianMalteseMarshalleseMenomineeMexicanMexican American IndianMongolianMoroccanNative HawaiianNavajoNepaleseNew ZealanderNicaraguanNigerianNorthern EuropeanNorwegianOkinawanOsageOttawaPaiutePakistaniPalestinianPanamanianParaguayanPennsylvania GermanPeruvianPimaPolishPortuguesePotawatomiPuebloPuerto RicanPuget Sound SalishRomanianRussianSalvadoranSamoanScandinavianScotch-IrishScottishSeminoleSenegaleseSerbianShoshoneSierra LeoneanSiouxSlavicSlovakSloveneSomaliSouth AfricanSouth AmericanSouth American IndianSoviet UnionSpaniardSpanishSpanish AmericanSpanish American IndianSri LankanSubsaharan AfricanSudaneseSwedishSwissSyrianTaiwaneseThaiTlingit-HaidaTohono O'OdhamTonganTrinidadian and TobagonianTsimshianTurkishU.S. Virgin IslanderUgandanUkrainianUruguayanUteVenezuelanVietnameseWelshWest IndianYakamaYaquiYugoslavianYumanYup'ikZimbabwean
Immigration
NonimmigrantsImmigrantsAfghanistanAfricaAlbaniaArgentinaArmeniaAsiaAustraliaAustriaBahamasBangladeshBarbadosBelarusBelgiumBelizeBoliviaBosnia and HerzegovinaBrazilBulgariaBurma/MyanmarCabo VerdeCambodiaCameroonCanadaCaribbeanCentral AmericaChileChinaColombiaCongoCosta RicaCroatiaCubaCzechoslovakiaDenmarkDominicaDominican RepublicEastern AfricaEastern AsiaEastern EuropeEcuadorEgyptEl SalvadorEnglandEritreaEthiopiaEuropeFijiFranceGermanyGhanaGreeceGrenadaGuatemalaGuyanaHaitiHondurasHong KongHungaryIndiaIndonesiaIranIraqIrelandIsraelItalyJamaicaJapanJordanKazakhstanKenyaKoreaKuwaitLaosLatin AmericaLatviaLebanonLiberiaLithuaniaMalaysiaMexicoMicronesiaMiddle AfricaMoldovaMoroccoNepalNetherlandsNicaraguaNigeriaNorth AmericaNorth MacedoniaNorthern AfricaNorthern EuropeNorwayOceaniaPanamaPeruPhilippinesPolandPortugalRomaniaRussiaSaudi ArabiaScotlandSenegalSerbiaSierra LeoneSingaporeSomaliaSouth AfricaSouth AmericaSouth Central AsiaSouth Eastern AsiaSouthern EuropeSpainSri LankaSt. Vincent and the GrenadinesSudanSwedenSwitzerlandSyriaTaiwanThailandTrinidad and TobagoTurkeyUgandaUkraineUruguayUzbekistanVenezuelaVietnamWest IndiesWestern AfricaWestern AsiaWestern EuropeYemenZaireZimbabweAzores
In Labor Force | Age > 16
Income
Poverty
Unemployment
Labor Participation
Family Structure
Vehicle Availability
Education Level
Disability

In Labor Force | Age > 16 Comparison

Immigrants from Pakistan

Immigrants from Denmark

Exceptional
Poor
66.7%
IN LABOR FORCE | AGE > 16
100.0/ 100
METRIC RATING
44th/ 347
METRIC RANK
64.8%
IN LABOR FORCE | AGE > 16
14.7/ 100
METRIC RATING
210th/ 347
METRIC RANK

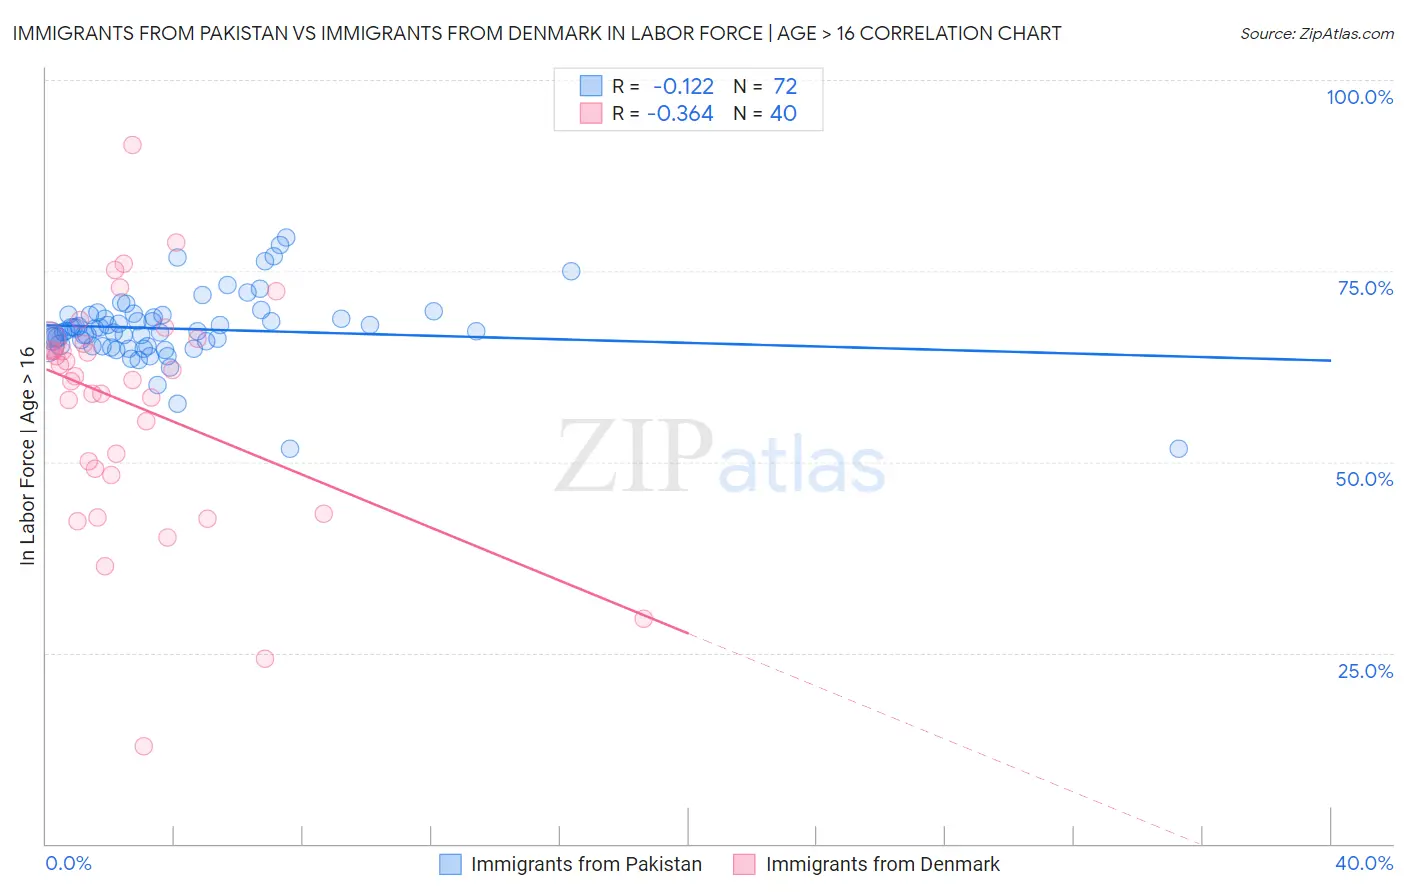
Immigrants from Pakistan vs Immigrants from Denmark In Labor Force | Age > 16 Correlation Chart

The statistical analysis conducted on geographies consisting of 283,909,562 people shows a poor negative correlation between the proportion of Immigrants from Pakistan and labor force participation rate among population ages 16 and over in the United States with a correlation coefficient (R) of -0.122 and weighted average of 66.7%. Similarly, the statistical analysis conducted on geographies consisting of 136,433,385 people shows a mild negative correlation between the proportion of Immigrants from Denmark and labor force participation rate among population ages 16 and over in the United States with a correlation coefficient (R) of -0.364 and weighted average of 64.8%, a difference of 2.9%.
Immigrants from Pakistan vs Immigrants from Denmark In Labor Force | Age > 16

In Labor Force | Age > 16 Correlation Summary

MeasurementImmigrants from PakistanImmigrants from Denmark
Minimum51.8%12.7%
Maximum79.3%91.5%
Range27.5%78.8%
Mean67.4%57.3%
Median67.1%61.0%
Interquartile 25% (IQ1)65.3%48.7%
Interquartile 75% (IQ3)69.2%65.6%
Interquartile Range (IQR)3.9%17.0%
Standard Deviation (Sample)4.7%15.4%
Standard Deviation (Population)4.6%15.2%

Similar Demographics by In Labor Force | Age > 16

Demographics Similar to Immigrants from Pakistan by In Labor Force | Age > 16

In terms of in labor force | age > 16, the demographic groups most similar to Immigrants from Pakistan are Luxembourger (66.7%, a difference of 0.050%), Immigrants from Brazil (66.7%, a difference of 0.050%), Senegalese (66.7%, a difference of 0.070%), Brazilian (66.6%, a difference of 0.12%), and Immigrants from Bulgaria (66.6%, a difference of 0.12%).
DemographicsRating | RankIn Labor Force | Age > 16
Immigrants | Afghanistan
100.0
/100
|
#37
Exceptional
67.0%
Immigrants | Nigeria
100.0
/100
|
#38
Exceptional
66.9%
Salvadorans
100.0
/100
|
#39
Exceptional
66.8%
Immigrants | El Salvador
100.0
/100
|
#40
Exceptional
66.8%
Immigrants | Zimbabwe
100.0
/100
|
#41
Exceptional
66.8%
Senegalese
100.0
/100
|
#42
Exceptional
66.7%
Luxembourgers
100.0
/100
|
#43
Exceptional
66.7%
Immigrants | Pakistan
100.0
/100
|
#44
Exceptional
66.7%
Immigrants | Brazil
100.0
/100
|
#45
Exceptional
66.7%
Brazilians
100.0
/100
|
#46
Exceptional
66.6%
Immigrants | Bulgaria
100.0
/100
|
#47
Exceptional
66.6%
Nigerians
100.0
/100
|
#48
Exceptional
66.6%
Immigrants | Northern Africa
100.0
/100
|
#49
Exceptional
66.6%
Cape Verdeans
100.0
/100
|
#50
Exceptional
66.6%
Immigrants | Kuwait
100.0
/100
|
#51
Exceptional
66.5%

Demographics Similar to Immigrants from Denmark by In Labor Force | Age > 16

In terms of in labor force | age > 16, the demographic groups most similar to Immigrants from Denmark are Fijian (64.8%, a difference of 0.010%), Immigrants from Trinidad and Tobago (64.8%, a difference of 0.020%), Alaskan Athabascan (64.8%, a difference of 0.020%), Maltese (64.8%, a difference of 0.020%), and Belizean (64.8%, a difference of 0.030%).
DemographicsRating | RankIn Labor Force | Age > 16
Russians
18.8
/100
|
#203
Poor
64.9%
Slovenes
18.7
/100
|
#204
Poor
64.9%
Jamaicans
18.7
/100
|
#205
Poor
64.9%
Lithuanians
17.4
/100
|
#206
Poor
64.8%
Immigrants | Latin America
16.4
/100
|
#207
Poor
64.8%
Belizeans
16.2
/100
|
#208
Poor
64.8%
Immigrants | Trinidad and Tobago
15.6
/100
|
#209
Poor
64.8%
Immigrants | Denmark
14.7
/100
|
#210
Poor
64.8%
Fijians
14.1
/100
|
#211
Poor
64.8%
Alaskan Athabascans
13.9
/100
|
#212
Poor
64.8%
Maltese
13.8
/100
|
#213
Poor
64.8%
Estonians
13.1
/100
|
#214
Poor
64.8%
Immigrants | Czechoslovakia
12.3
/100
|
#215
Poor
64.8%
Belgians
11.4
/100
|
#216
Poor
64.7%
U.S. Virgin Islanders
11.3
/100
|
#217
Poor
64.7%