Immigrants from Pakistan vs Fijian In Labor Force | Age 16-19

COMPARE

Immigrants from Pakistan
Race
Ancestry
AfghanAfricanAlaska NativeAlaskan AthabascanAlbanianAleutAlsatianAmericanApacheArabArapahoArgentineanArmenianAssyrian/Chaldean/SyriacAustralianAustrianBahamianBangladeshiBarbadianBasqueBelgianBelizeanBermudanBhutaneseBlackfeetBolivianBrazilianBritishBritish West IndianBulgarianBurmeseCajunCambodianCanadianCape VerdeanCarpatho RusynCelticCentral AmericanCentral American IndianCherokeeCheyenneChickasawChileanChineseChippewaChoctawColombianColvilleComancheCosta RicanCreeCreekCroatianCrowCubanCypriotCzechCzechoslovakianDanishDelawareDominicanDutchDutch West IndianEastern EuropeanEcuadorianEgyptianEnglishEstonianEthiopianEuropeanFilipinoFinnishFrenchFrench American IndianFrench CanadianGermanGerman RussianGhanaianGreekGuamanian/ChamorroGuatemalanGuyaneseHaitianHmongHonduranHopiHoumaHungarianIcelanderIndian (Asian)IndonesianInupiatIranianIraqiIrishIroquoisIsraeliItalianJamaicanJapaneseJordanianKenyanKiowaKoreanLaotianLatvianLebaneseLiberianLithuanianLumbeeLuxembourgerMacedonianMalaysianMalteseMarshalleseMenomineeMexicanMexican American IndianMongolianMoroccanNative HawaiianNavajoNepaleseNew ZealanderNicaraguanNigerianNorthern EuropeanNorwegianOkinawanOsageOttawaPaiutePakistaniPalestinianPanamanianParaguayanPennsylvania GermanPeruvianPimaPolishPortuguesePotawatomiPuebloPuerto RicanPuget Sound SalishRomanianRussianSalvadoranSamoanScandinavianScotch-IrishScottishSeminoleSenegaleseSerbianShoshoneSierra LeoneanSiouxSlavicSlovakSloveneSomaliSouth AfricanSouth AmericanSouth American IndianSoviet UnionSpaniardSpanishSpanish AmericanSpanish American IndianSri LankanSubsaharan AfricanSudaneseSwedishSwissSyrianTaiwaneseThaiTlingit-HaidaTohono O'OdhamTonganTrinidadian and TobagonianTsimshianTurkishU.S. Virgin IslanderUgandanUkrainianUruguayanUteVenezuelanVietnameseWelshWest IndianYakamaYaquiYugoslavianYumanYup'ikZimbabwean
Immigration
NonimmigrantsImmigrantsAfghanistanAfricaAlbaniaArgentinaArmeniaAsiaAustraliaAustriaBahamasBangladeshBarbadosBelarusBelgiumBelizeBoliviaBosnia and HerzegovinaBrazilBulgariaBurma/MyanmarCabo VerdeCambodiaCameroonCanadaCaribbeanCentral AmericaChileChinaColombiaCongoCosta RicaCroatiaCubaCzechoslovakiaDenmarkDominicaDominican RepublicEastern AfricaEastern AsiaEastern EuropeEcuadorEgyptEl SalvadorEnglandEritreaEthiopiaEuropeFijiFranceGermanyGhanaGreeceGrenadaGuatemalaGuyanaHaitiHondurasHong KongHungaryIndiaIndonesiaIranIraqIrelandIsraelItalyJamaicaJapanJordanKazakhstanKenyaKoreaKuwaitLaosLatin AmericaLatviaLebanonLiberiaLithuaniaMalaysiaMexicoMicronesiaMiddle AfricaMoldovaMoroccoNepalNetherlandsNicaraguaNigeriaNorth AmericaNorth MacedoniaNorthern AfricaNorthern EuropeNorwayOceaniaPakistanPanamaPeruPhilippinesPolandPortugalRomaniaRussiaSaudi ArabiaScotlandSenegalSerbiaSierra LeoneSingaporeSomaliaSouth AfricaSouth AmericaSouth Central AsiaSouth Eastern AsiaSouthern EuropeSpainSri LankaSt. Vincent and the GrenadinesSudanSwedenSwitzerlandSyriaTaiwanThailandTrinidad and TobagoTurkeyUgandaUkraineUruguayUzbekistanVenezuelaVietnamWest IndiesWestern AfricaWestern AsiaWestern EuropeYemenZaireZimbabweAzores
Fijian
Race
Ancestry
AfghanAfricanAlaska NativeAlaskan AthabascanAlbanianAleutAlsatianAmericanApacheArabArapahoArgentineanArmenianAssyrian/Chaldean/SyriacAustralianAustrianBahamianBangladeshiBarbadianBasqueBelgianBelizeanBermudanBhutaneseBlackfeetBolivianBrazilianBritishBritish West IndianBulgarianBurmeseCajunCambodianCanadianCape VerdeanCarpatho RusynCelticCentral AmericanCentral American IndianCherokeeCheyenneChickasawChileanChineseChippewaChoctawColombianColvilleComancheCosta RicanCreeCreekCroatianCrowCubanCypriotCzechCzechoslovakianDanishDelawareDominicanDutchDutch West IndianEastern EuropeanEcuadorianEgyptianEnglishEstonianEthiopianEuropeanFijianFilipinoFinnishFrenchFrench American IndianFrench CanadianGermanGerman RussianGhanaianGreekGuamanian/ChamorroGuatemalanGuyaneseHaitianHmongHonduranHopiHoumaHungarianIcelanderIndian (Asian)IndonesianInupiatIranianIraqiIrishIroquoisIsraeliItalianJamaicanJapaneseJordanianKenyanKiowaKoreanLaotianLatvianLebaneseLiberianLithuanianLumbeeLuxembourgerMacedonianMalaysianMalteseMarshalleseMenomineeMexicanMexican American IndianMongolianMoroccanNative HawaiianNavajoNepaleseNew ZealanderNicaraguanNigerianNorthern EuropeanNorwegianOkinawanOsageOttawaPaiutePakistaniPalestinianPanamanianParaguayanPennsylvania GermanPeruvianPimaPolishPortuguesePotawatomiPuebloPuerto RicanPuget Sound SalishRomanianRussianSalvadoranSamoanScandinavianScotch-IrishScottishSeminoleSenegaleseSerbianShoshoneSierra LeoneanSiouxSlavicSlovakSloveneSomaliSouth AfricanSouth AmericanSouth American IndianSoviet UnionSpaniardSpanishSpanish AmericanSpanish American IndianSri LankanSubsaharan AfricanSudaneseSwedishSwissSyrianTaiwaneseThaiTlingit-HaidaTohono O'OdhamTonganTrinidadian and TobagonianTsimshianTurkishU.S. Virgin IslanderUgandanUkrainianUruguayanUteVenezuelanVietnameseWelshWest IndianYakamaYaquiYugoslavianYumanYup'ikZimbabwean
Immigration
NonimmigrantsImmigrantsAfghanistanAfricaAlbaniaArgentinaArmeniaAsiaAustraliaAustriaBahamasBangladeshBarbadosBelarusBelgiumBelizeBoliviaBosnia and HerzegovinaBrazilBulgariaBurma/MyanmarCabo VerdeCambodiaCameroonCanadaCaribbeanCentral AmericaChileChinaColombiaCongoCosta RicaCroatiaCubaCzechoslovakiaDenmarkDominicaDominican RepublicEastern AfricaEastern AsiaEastern EuropeEcuadorEgyptEl SalvadorEnglandEritreaEthiopiaEuropeFijiFranceGermanyGhanaGreeceGrenadaGuatemalaGuyanaHaitiHondurasHong KongHungaryIndiaIndonesiaIranIraqIrelandIsraelItalyJamaicaJapanJordanKazakhstanKenyaKoreaKuwaitLaosLatin AmericaLatviaLebanonLiberiaLithuaniaMalaysiaMexicoMicronesiaMiddle AfricaMoldovaMoroccoNepalNetherlandsNicaraguaNigeriaNorth AmericaNorth MacedoniaNorthern AfricaNorthern EuropeNorwayOceaniaPanamaPeruPhilippinesPolandPortugalRomaniaRussiaSaudi ArabiaScotlandSenegalSerbiaSierra LeoneSingaporeSomaliaSouth AfricaSouth AmericaSouth Central AsiaSouth Eastern AsiaSouthern EuropeSpainSri LankaSt. Vincent and the GrenadinesSudanSwedenSwitzerlandSyriaTaiwanThailandTrinidad and TobagoTurkeyUgandaUkraineUruguayUzbekistanVenezuelaVietnamWest IndiesWestern AfricaWestern AsiaWestern EuropeYemenZaireZimbabweAzores
In Labor Force | Age 16-19
Income
Poverty
Unemployment
Labor Participation
Family Structure
Vehicle Availability
Education Level
Disability

In Labor Force | Age 16-19 Comparison

Immigrants from Pakistan

Fijians

Tragic
Exceptional
34.8%
IN LABOR FORCE | AGE 16-19
2.0/ 100
METRIC RATING
250th/ 347
METRIC RANK
40.4%
IN LABOR FORCE | AGE 16-19
100.0/ 100
METRIC RATING
56th/ 347
METRIC RANK

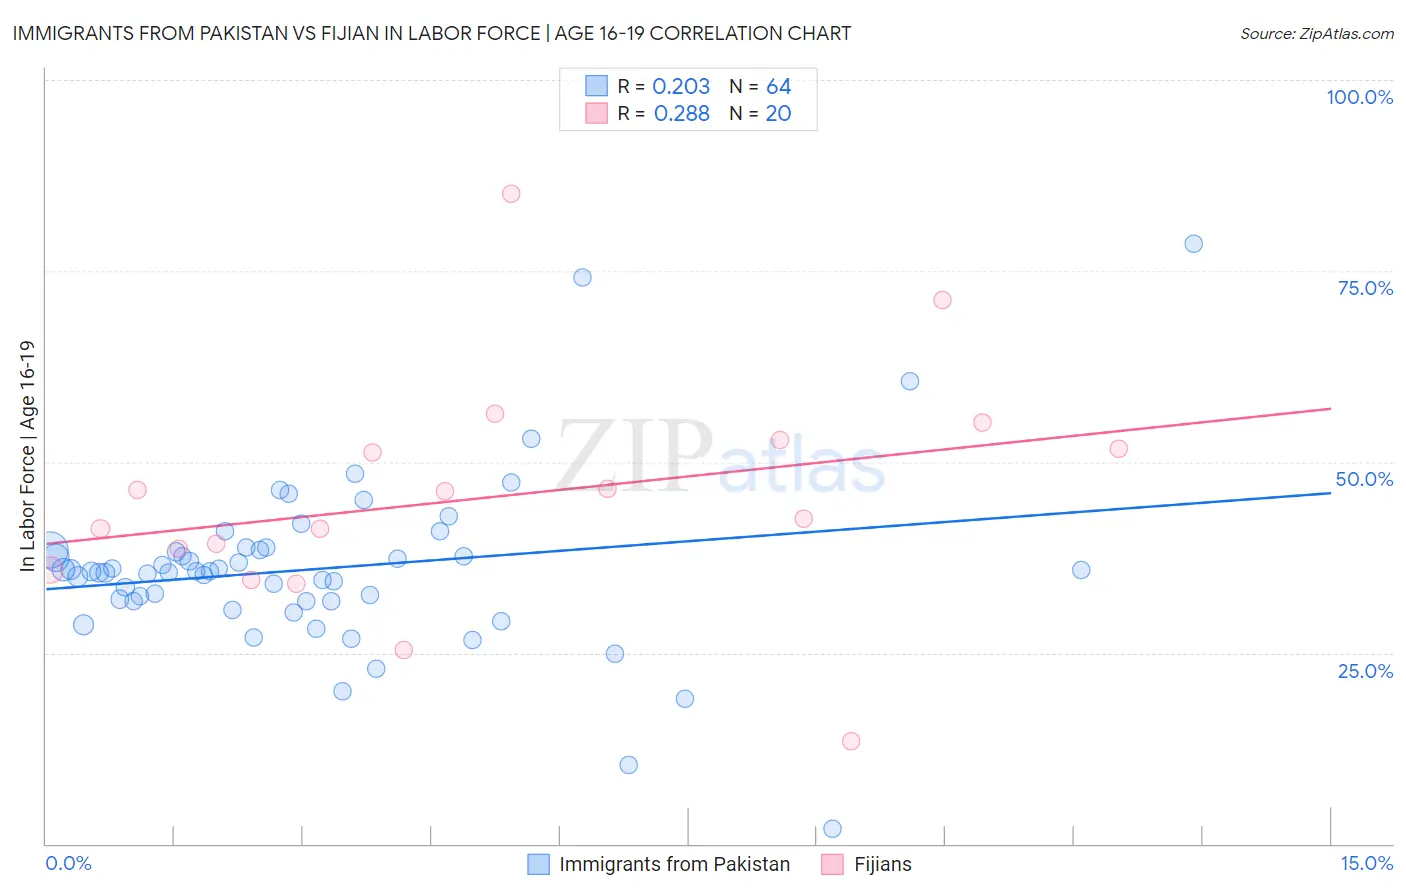
Immigrants from Pakistan vs Fijian In Labor Force | Age 16-19 Correlation Chart

The statistical analysis conducted on geographies consisting of 283,687,776 people shows a weak positive correlation between the proportion of Immigrants from Pakistan and labor force participation rate among population between the ages 16 and 19 in the United States with a correlation coefficient (R) of 0.203 and weighted average of 34.8%. Similarly, the statistical analysis conducted on geographies consisting of 55,922,250 people shows a weak positive correlation between the proportion of Fijians and labor force participation rate among population between the ages 16 and 19 in the United States with a correlation coefficient (R) of 0.288 and weighted average of 40.4%, a difference of 16.3%.
Immigrants from Pakistan vs Fijian In Labor Force | Age 16-19

In Labor Force | Age 16-19 Correlation Summary

MeasurementImmigrants from PakistanFijian
Minimum2.0%13.4%
Maximum78.6%85.1%
Range76.6%71.7%
Mean36.0%45.4%
Median35.7%44.4%
Interquartile 25% (IQ1)31.8%37.2%
Interquartile 75% (IQ3)38.5%52.2%
Interquartile Range (IQR)6.7%15.0%
Standard Deviation (Sample)11.4%15.4%
Standard Deviation (Population)11.3%15.0%

Similar Demographics by In Labor Force | Age 16-19

Demographics Similar to Immigrants from Pakistan by In Labor Force | Age 16-19

In terms of in labor force | age 16-19, the demographic groups most similar to Immigrants from Pakistan are Immigrants from Western Asia (34.8%, a difference of 0.020%), Immigrants from Chile (34.8%, a difference of 0.030%), Immigrants from Ukraine (34.8%, a difference of 0.10%), Central American (34.8%, a difference of 0.13%), and Laotian (34.9%, a difference of 0.21%).
DemographicsRating | RankIn Labor Force | Age 16-19
Pueblo
2.6
/100
|
#243
Tragic
34.9%
Immigrants | Turkey
2.6
/100
|
#244
Tragic
34.9%
Immigrants | Greece
2.4
/100
|
#245
Tragic
34.9%
Immigrants | Sri Lanka
2.4
/100
|
#246
Tragic
34.9%
Laotians
2.4
/100
|
#247
Tragic
34.9%
Central Americans
2.2
/100
|
#248
Tragic
34.8%
Immigrants | Ukraine
2.2
/100
|
#249
Tragic
34.8%
Immigrants | Pakistan
2.0
/100
|
#250
Tragic
34.8%
Immigrants | Western Asia
2.0
/100
|
#251
Tragic
34.8%
Immigrants | Chile
2.0
/100
|
#252
Tragic
34.8%
Immigrants | Japan
1.5
/100
|
#253
Tragic
34.7%
Bahamians
1.4
/100
|
#254
Tragic
34.6%
Peruvians
1.4
/100
|
#255
Tragic
34.6%
Immigrants | South Central Asia
1.3
/100
|
#256
Tragic
34.6%
Immigrants | Egypt
1.2
/100
|
#257
Tragic
34.6%

Demographics Similar to Fijians by In Labor Force | Age 16-19

In terms of in labor force | age 16-19, the demographic groups most similar to Fijians are Lithuanian (40.4%, a difference of 0.030%), Aleut (40.4%, a difference of 0.040%), British (40.5%, a difference of 0.090%), Tlingit-Haida (40.5%, a difference of 0.12%), and Immigrants from Kenya (40.5%, a difference of 0.15%).
DemographicsRating | RankIn Labor Force | Age 16-19
Cree
100.0
/100
|
#49
Exceptional
40.8%
Indonesians
100.0
/100
|
#50
Exceptional
40.7%
Immigrants | Zaire
100.0
/100
|
#51
Exceptional
40.7%
Immigrants | Laos
100.0
/100
|
#52
Exceptional
40.6%
Immigrants | Kenya
100.0
/100
|
#53
Exceptional
40.5%
Tlingit-Haida
100.0
/100
|
#54
Exceptional
40.5%
British
100.0
/100
|
#55
Exceptional
40.5%
Fijians
100.0
/100
|
#56
Exceptional
40.4%
Lithuanians
100.0
/100
|
#57
Exceptional
40.4%
Aleuts
100.0
/100
|
#58
Exceptional
40.4%
Slavs
100.0
/100
|
#59
Exceptional
40.4%
Immigrants | Eastern Africa
100.0
/100
|
#60
Exceptional
40.4%
Americans
100.0
/100
|
#61
Exceptional
40.3%
Cherokee
100.0
/100
|
#62
Exceptional
40.2%
Northern Europeans
100.0
/100
|
#63
Exceptional
40.2%