Immigrants from Norway vs Immigrants from Congo In Labor Force | Age 35-44
COMPARE
Immigrants from Norway
Immigrants from Congo
In Labor Force | Age 35-44
In Labor Force | Age 35-44 Comparison
Immigrants from Norway
Immigrants from Congo
84.1%
IN LABOR FORCE | AGE 35-44
11.7/ 100
METRIC RATING
217th/ 347
METRIC RANK
83.5%
IN LABOR FORCE | AGE 35-44
0.2/ 100
METRIC RATING
262nd/ 347
METRIC RANK
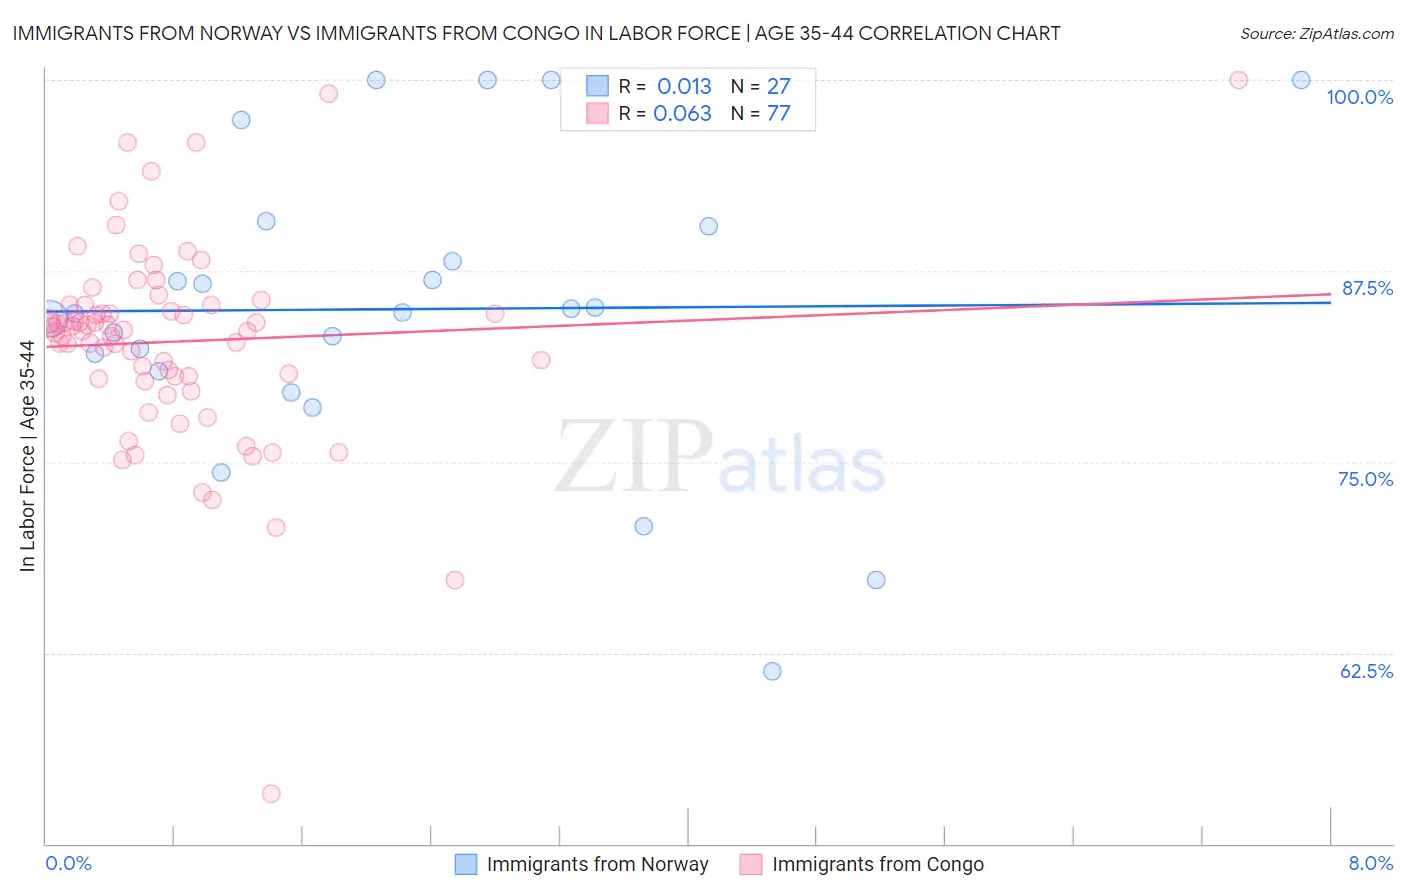
Immigrants from Norway vs Immigrants from Congo In Labor Force | Age 35-44 Correlation Chart
The statistical analysis conducted on geographies consisting of 116,704,105 people shows no correlation between the proportion of Immigrants from Norway and labor force participation rate among population between the ages 35 and 44 in the United States with a correlation coefficient (R) of 0.013 and weighted average of 84.1%. Similarly, the statistical analysis conducted on geographies consisting of 92,106,989 people shows a slight positive correlation between the proportion of Immigrants from Congo and labor force participation rate among population between the ages 35 and 44 in the United States with a correlation coefficient (R) of 0.063 and weighted average of 83.5%, a difference of 0.70%.
In Labor Force | Age 35-44 Correlation Summary
| Measurement | Immigrants from Norway | Immigrants from Congo |
| Minimum | 61.3% | 53.3% |
| Maximum | 100.0% | 100.0% |
| Range | 38.7% | 46.7% |
| Mean | 85.0% | 82.9% |
| Median | 84.8% | 83.6% |
| Interquartile 25% (IQ1) | 80.9% | 80.5% |
| Interquartile 75% (IQ3) | 90.4% | 85.3% |
| Interquartile Range (IQR) | 9.5% | 4.7% |
| Standard Deviation (Sample) | 9.7% | 6.7% |
| Standard Deviation (Population) | 9.5% | 6.7% |
Similar Demographics by In Labor Force | Age 35-44
Demographics Similar to Immigrants from Norway by In Labor Force | Age 35-44
In terms of in labor force | age 35-44, the demographic groups most similar to Immigrants from Norway are European (84.1%, a difference of 0.010%), Nicaraguan (84.1%, a difference of 0.010%), Immigrants from Barbados (84.1%, a difference of 0.020%), Israeli (84.1%, a difference of 0.030%), and Bangladeshi (84.1%, a difference of 0.030%).
| Demographics | Rating | Rank | In Labor Force | Age 35-44 |
| New Zealanders | 16.2 /100 | #210 | Poor 84.1% |
| Immigrants | Ecuador | 15.2 /100 | #211 | Poor 84.1% |
| Israelis | 14.0 /100 | #212 | Poor 84.1% |
| Bangladeshis | 13.7 /100 | #213 | Poor 84.1% |
| Immigrants | Barbados | 13.2 /100 | #214 | Poor 84.1% |
| Europeans | 12.2 /100 | #215 | Poor 84.1% |
| Nicaraguans | 12.1 /100 | #216 | Poor 84.1% |
| Immigrants | Norway | 11.7 /100 | #217 | Poor 84.1% |
| Immigrants | Nicaragua | 9.4 /100 | #218 | Tragic 84.1% |
| Sub-Saharan Africans | 9.3 /100 | #219 | Tragic 84.1% |
| French | 7.5 /100 | #220 | Tragic 84.0% |
| Icelanders | 6.7 /100 | #221 | Tragic 84.0% |
| Assyrians/Chaldeans/Syriacs | 6.6 /100 | #222 | Tragic 84.0% |
| Immigrants | Panama | 6.4 /100 | #223 | Tragic 84.0% |
| U.S. Virgin Islanders | 6.1 /100 | #224 | Tragic 84.0% |
Demographics Similar to Immigrants from Congo by In Labor Force | Age 35-44
In terms of in labor force | age 35-44, the demographic groups most similar to Immigrants from Congo are Vietnamese (83.5%, a difference of 0.010%), Immigrants from Dominica (83.5%, a difference of 0.010%), Immigrants from El Salvador (83.5%, a difference of 0.020%), Iroquois (83.5%, a difference of 0.030%), and Tsimshian (83.5%, a difference of 0.040%).
| Demographics | Rating | Rank | In Labor Force | Age 35-44 |
| Immigrants | Azores | 0.3 /100 | #255 | Tragic 83.6% |
| Japanese | 0.3 /100 | #256 | Tragic 83.6% |
| Basques | 0.3 /100 | #257 | Tragic 83.6% |
| Tsimshian | 0.2 /100 | #258 | Tragic 83.5% |
| Immigrants | El Salvador | 0.2 /100 | #259 | Tragic 83.5% |
| Vietnamese | 0.2 /100 | #260 | Tragic 83.5% |
| Immigrants | Dominica | 0.2 /100 | #261 | Tragic 83.5% |
| Immigrants | Congo | 0.2 /100 | #262 | Tragic 83.5% |
| Iroquois | 0.2 /100 | #263 | Tragic 83.5% |
| Scotch-Irish | 0.1 /100 | #264 | Tragic 83.5% |
| Central Americans | 0.1 /100 | #265 | Tragic 83.5% |
| Spaniards | 0.1 /100 | #266 | Tragic 83.4% |
| Guamanians/Chamorros | 0.1 /100 | #267 | Tragic 83.4% |
| Hondurans | 0.1 /100 | #268 | Tragic 83.4% |
| Immigrants | Grenada | 0.1 /100 | #269 | Tragic 83.3% |