Immigrants from North America vs Finnish In Labor Force | Age 25-29

COMPARE

Immigrants from North America
Race
Ancestry
AfghanAfricanAlaska NativeAlaskan AthabascanAlbanianAleutAlsatianAmericanApacheArabArapahoArgentineanArmenianAssyrian/Chaldean/SyriacAustralianAustrianBahamianBangladeshiBarbadianBasqueBelgianBelizeanBermudanBhutaneseBlackfeetBolivianBrazilianBritishBritish West IndianBulgarianBurmeseCajunCambodianCanadianCape VerdeanCarpatho RusynCelticCentral AmericanCentral American IndianCherokeeCheyenneChickasawChileanChineseChippewaChoctawColombianColvilleComancheCosta RicanCreeCreekCroatianCrowCubanCypriotCzechCzechoslovakianDanishDelawareDominicanDutchDutch West IndianEastern EuropeanEcuadorianEgyptianEnglishEstonianEthiopianEuropeanFijianFilipinoFrenchFrench American IndianFrench CanadianGermanGerman RussianGhanaianGreekGuamanian/ChamorroGuatemalanGuyaneseHaitianHmongHonduranHopiHoumaHungarianIcelanderIndian (Asian)IndonesianInupiatIranianIraqiIrishIroquoisIsraeliItalianJamaicanJapaneseJordanianKenyanKiowaKoreanLaotianLatvianLebaneseLiberianLithuanianLumbeeLuxembourgerMacedonianMalaysianMalteseMarshalleseMenomineeMexicanMexican American IndianMongolianMoroccanNative HawaiianNavajoNepaleseNew ZealanderNicaraguanNigerianNorthern EuropeanNorwegianOkinawanOsageOttawaPaiutePakistaniPalestinianPanamanianParaguayanPennsylvania GermanPeruvianPimaPolishPortuguesePotawatomiPuebloPuerto RicanPuget Sound SalishRomanianRussianSalvadoranSamoanScandinavianScotch-IrishScottishSeminoleSenegaleseSerbianShoshoneSierra LeoneanSiouxSlavicSlovakSloveneSomaliSouth AfricanSouth AmericanSouth American IndianSoviet UnionSpaniardSpanishSpanish AmericanSpanish American IndianSri LankanSubsaharan AfricanSudaneseSwedishSwissSyrianTaiwaneseThaiTlingit-HaidaTohono O'OdhamTonganTrinidadian and TobagonianTsimshianTurkishU.S. Virgin IslanderUgandanUkrainianUruguayanUteVenezuelanVietnameseWelshWest IndianYakamaYaquiYugoslavianYumanYup'ikZimbabwean
Immigration
NonimmigrantsImmigrantsAfghanistanAfricaAlbaniaArgentinaArmeniaAsiaAustraliaAustriaBahamasBangladeshBarbadosBelarusBelgiumBelizeBoliviaBosnia and HerzegovinaBrazilBulgariaBurma/MyanmarCabo VerdeCambodiaCameroonCanadaCaribbeanCentral AmericaChileChinaColombiaCongoCosta RicaCroatiaCubaCzechoslovakiaDenmarkDominicaDominican RepublicEastern AfricaEastern AsiaEastern EuropeEcuadorEgyptEl SalvadorEnglandEritreaEthiopiaEuropeFijiFranceGermanyGhanaGreeceGrenadaGuatemalaGuyanaHaitiHondurasHong KongHungaryIndiaIndonesiaIranIraqIrelandIsraelItalyJamaicaJapanJordanKazakhstanKenyaKoreaKuwaitLaosLatin AmericaLatviaLebanonLiberiaLithuaniaMalaysiaMexicoMicronesiaMiddle AfricaMoldovaMoroccoNepalNetherlandsNicaraguaNigeriaNorth AmericaNorth MacedoniaNorthern AfricaNorthern EuropeNorwayOceaniaPakistanPanamaPeruPhilippinesPolandPortugalRomaniaRussiaSaudi ArabiaScotlandSenegalSerbiaSierra LeoneSingaporeSomaliaSouth AfricaSouth AmericaSouth Central AsiaSouth Eastern AsiaSouthern EuropeSpainSri LankaSt. Vincent and the GrenadinesSudanSwedenSwitzerlandSyriaTaiwanThailandTrinidad and TobagoTurkeyUgandaUkraineUruguayUzbekistanVenezuelaVietnamWest IndiesWestern AfricaWestern AsiaWestern EuropeYemenZaireZimbabweAzores
Finnish
Race
Ancestry
AfghanAfricanAlaska NativeAlaskan AthabascanAlbanianAleutAlsatianAmericanApacheArabArapahoArgentineanArmenianAssyrian/Chaldean/SyriacAustralianAustrianBahamianBangladeshiBarbadianBasqueBelgianBelizeanBermudanBhutaneseBlackfeetBolivianBrazilianBritishBritish West IndianBulgarianBurmeseCajunCambodianCanadianCape VerdeanCarpatho RusynCelticCentral AmericanCentral American IndianCherokeeCheyenneChickasawChileanChineseChippewaChoctawColombianColvilleComancheCosta RicanCreeCreekCroatianCrowCubanCypriotCzechCzechoslovakianDanishDelawareDominicanDutchDutch West IndianEastern EuropeanEcuadorianEgyptianEnglishEstonianEthiopianEuropeanFijianFilipinoFinnishFrenchFrench American IndianFrench CanadianGermanGerman RussianGhanaianGreekGuamanian/ChamorroGuatemalanGuyaneseHaitianHmongHonduranHopiHoumaHungarianIcelanderIndian (Asian)IndonesianInupiatIranianIraqiIrishIroquoisIsraeliItalianJamaicanJapaneseJordanianKenyanKiowaKoreanLaotianLatvianLebaneseLiberianLithuanianLumbeeLuxembourgerMacedonianMalaysianMalteseMarshalleseMenomineeMexicanMexican American IndianMongolianMoroccanNative HawaiianNavajoNepaleseNew ZealanderNicaraguanNigerianNorthern EuropeanNorwegianOkinawanOsageOttawaPaiutePakistaniPalestinianPanamanianParaguayanPennsylvania GermanPeruvianPimaPolishPortuguesePotawatomiPuebloPuerto RicanPuget Sound SalishRomanianRussianSalvadoranSamoanScandinavianScotch-IrishScottishSeminoleSenegaleseSerbianShoshoneSierra LeoneanSiouxSlavicSlovakSloveneSomaliSouth AfricanSouth AmericanSouth American IndianSoviet UnionSpaniardSpanishSpanish AmericanSpanish American IndianSri LankanSubsaharan AfricanSudaneseSwedishSwissSyrianTaiwaneseThaiTlingit-HaidaTohono O'OdhamTonganTrinidadian and TobagonianTsimshianTurkishU.S. Virgin IslanderUgandanUkrainianUruguayanUteVenezuelanVietnameseWelshWest IndianYakamaYaquiYugoslavianYumanYup'ikZimbabwean
Immigration
NonimmigrantsImmigrantsAfghanistanAfricaAlbaniaArgentinaArmeniaAsiaAustraliaAustriaBahamasBangladeshBarbadosBelarusBelgiumBelizeBoliviaBosnia and HerzegovinaBrazilBulgariaBurma/MyanmarCabo VerdeCambodiaCameroonCanadaCaribbeanCentral AmericaChileChinaColombiaCongoCosta RicaCroatiaCubaCzechoslovakiaDenmarkDominicaDominican RepublicEastern AfricaEastern AsiaEastern EuropeEcuadorEgyptEl SalvadorEnglandEritreaEthiopiaEuropeFijiFranceGermanyGhanaGreeceGrenadaGuatemalaGuyanaHaitiHondurasHong KongHungaryIndiaIndonesiaIranIraqIrelandIsraelItalyJamaicaJapanJordanKazakhstanKenyaKoreaKuwaitLaosLatin AmericaLatviaLebanonLiberiaLithuaniaMalaysiaMexicoMicronesiaMiddle AfricaMoldovaMoroccoNepalNetherlandsNicaraguaNigeriaNorth MacedoniaNorthern AfricaNorthern EuropeNorwayOceaniaPakistanPanamaPeruPhilippinesPolandPortugalRomaniaRussiaSaudi ArabiaScotlandSenegalSerbiaSierra LeoneSingaporeSomaliaSouth AfricaSouth AmericaSouth Central AsiaSouth Eastern AsiaSouthern EuropeSpainSri LankaSt. Vincent and the GrenadinesSudanSwedenSwitzerlandSyriaTaiwanThailandTrinidad and TobagoTurkeyUgandaUkraineUruguayUzbekistanVenezuelaVietnamWest IndiesWestern AfricaWestern AsiaWestern EuropeYemenZaireZimbabweAzores
In Labor Force | Age 25-29
Income
Poverty
Unemployment
Labor Participation
Family Structure
Vehicle Availability
Education Level
Disability

In Labor Force | Age 25-29 Comparison

Immigrants from North America

Finns

Good
Excellent
84.8%
IN LABOR FORCE | AGE 25-29
72.1/ 100
METRIC RATING
140th/ 347
METRIC RANK
85.0%
IN LABOR FORCE | AGE 25-29
87.8/ 100
METRIC RATING
118th/ 347
METRIC RANK

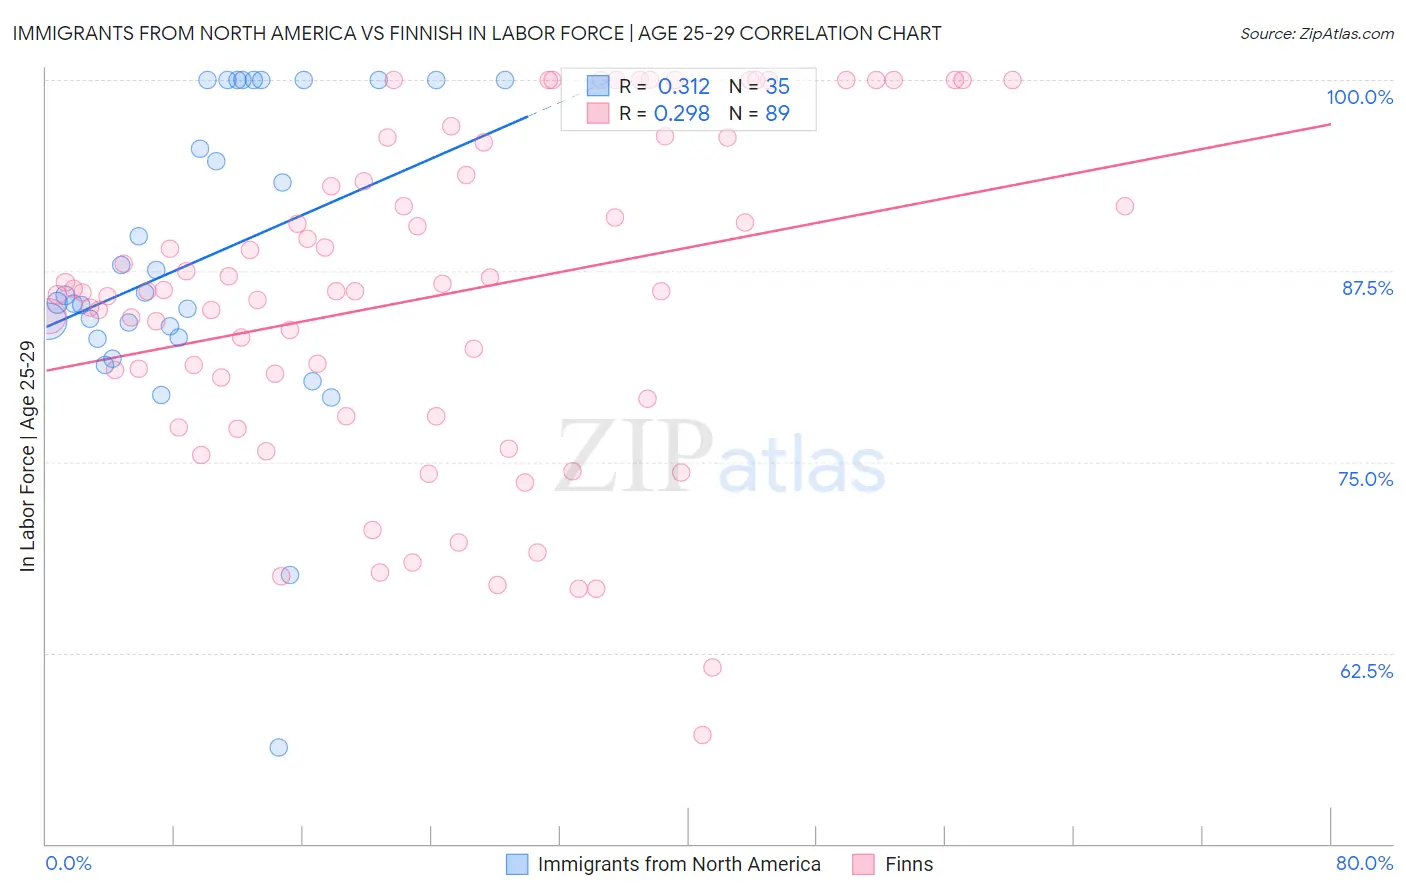
Immigrants from North America vs Finnish In Labor Force | Age 25-29 Correlation Chart

The statistical analysis conducted on geographies consisting of 462,119,191 people shows a mild positive correlation between the proportion of Immigrants from North America and labor force participation rate among population between the ages 25 and 29 in the United States with a correlation coefficient (R) of 0.312 and weighted average of 84.8%. Similarly, the statistical analysis conducted on geographies consisting of 404,431,499 people shows a weak positive correlation between the proportion of Finns and labor force participation rate among population between the ages 25 and 29 in the United States with a correlation coefficient (R) of 0.298 and weighted average of 85.0%, a difference of 0.19%.
Immigrants from North America vs Finnish In Labor Force | Age 25-29

In Labor Force | Age 25-29 Correlation Summary

MeasurementImmigrants from North AmericaFinnish
Minimum56.3%57.1%
Maximum100.0%100.0%
Range43.7%42.9%
Mean88.3%85.8%
Median85.9%86.2%
Interquartile 25% (IQ1)83.2%78.6%
Interquartile 75% (IQ3)100.0%94.9%
Interquartile Range (IQR)16.8%16.3%
Standard Deviation (Sample)10.0%10.6%
Standard Deviation (Population)9.9%10.6%

Similar Demographics by In Labor Force | Age 25-29

Demographics Similar to Immigrants from North America by In Labor Force | Age 25-29

In terms of in labor force | age 25-29, the demographic groups most similar to Immigrants from North America are Immigrants from Eastern Asia (84.8%, a difference of 0.0%), Danish (84.8%, a difference of 0.0%), Immigrants from Canada (84.8%, a difference of 0.010%), Armenian (84.8%, a difference of 0.010%), and Pakistani (84.8%, a difference of 0.020%).
DemographicsRating | RankIn Labor Force | Age 25-29
Asians
77.7
/100
|
#133
Good
84.8%
Syrians
76.5
/100
|
#134
Good
84.8%
Immigrants | Hungary
76.4
/100
|
#135
Good
84.8%
Bhutanese
76.0
/100
|
#136
Good
84.8%
Immigrants | Canada
73.5
/100
|
#137
Good
84.8%
Armenians
72.7
/100
|
#138
Good
84.8%
Immigrants | Eastern Asia
72.6
/100
|
#139
Good
84.8%
Immigrants | North America
72.1
/100
|
#140
Good
84.8%
Danes
71.9
/100
|
#141
Good
84.8%
Pakistanis
70.0
/100
|
#142
Good
84.8%
Sri Lankans
69.2
/100
|
#143
Good
84.8%
Immigrants | Laos
69.0
/100
|
#144
Good
84.8%
Immigrants | Senegal
68.3
/100
|
#145
Good
84.8%
Icelanders
68.2
/100
|
#146
Good
84.8%
Immigrants | Asia
68.2
/100
|
#147
Good
84.8%

Demographics Similar to Finns by In Labor Force | Age 25-29

In terms of in labor force | age 25-29, the demographic groups most similar to Finns are Immigrants from Belarus (85.0%, a difference of 0.0%), Filipino (84.9%, a difference of 0.010%), South African (85.0%, a difference of 0.020%), Chilean (85.0%, a difference of 0.020%), and Immigrants from South Africa (84.9%, a difference of 0.030%).
DemographicsRating | RankIn Labor Force | Age 25-29
Immigrants | Middle Africa
91.4
/100
|
#111
Exceptional
85.0%
Senegalese
90.9
/100
|
#112
Exceptional
85.0%
Irish
90.6
/100
|
#113
Exceptional
85.0%
Immigrants | Malaysia
90.4
/100
|
#114
Exceptional
85.0%
South Africans
88.9
/100
|
#115
Excellent
85.0%
Chileans
88.8
/100
|
#116
Excellent
85.0%
Immigrants | Belarus
88.0
/100
|
#117
Excellent
85.0%
Finns
87.8
/100
|
#118
Excellent
85.0%
Filipinos
87.1
/100
|
#119
Excellent
84.9%
Immigrants | South Africa
86.1
/100
|
#120
Excellent
84.9%
Immigrants | Chile
85.6
/100
|
#121
Excellent
84.9%
Scandinavians
85.1
/100
|
#122
Excellent
84.9%
Dutch
84.9
/100
|
#123
Excellent
84.9%
Immigrants | Iran
84.8
/100
|
#124
Excellent
84.9%
Uruguayans
84.7
/100
|
#125
Excellent
84.9%