Immigrants from Nigeria vs Panamanian In Labor Force | Age 35-44
COMPARE
Immigrants from Nigeria
Panamanian
In Labor Force | Age 35-44
In Labor Force | Age 35-44 Comparison
Immigrants from Nigeria
Panamanians
84.5%
IN LABOR FORCE | AGE 35-44
73.3/ 100
METRIC RATING
150th/ 347
METRIC RANK
84.0%
IN LABOR FORCE | AGE 35-44
5.4/ 100
METRIC RATING
226th/ 347
METRIC RANK
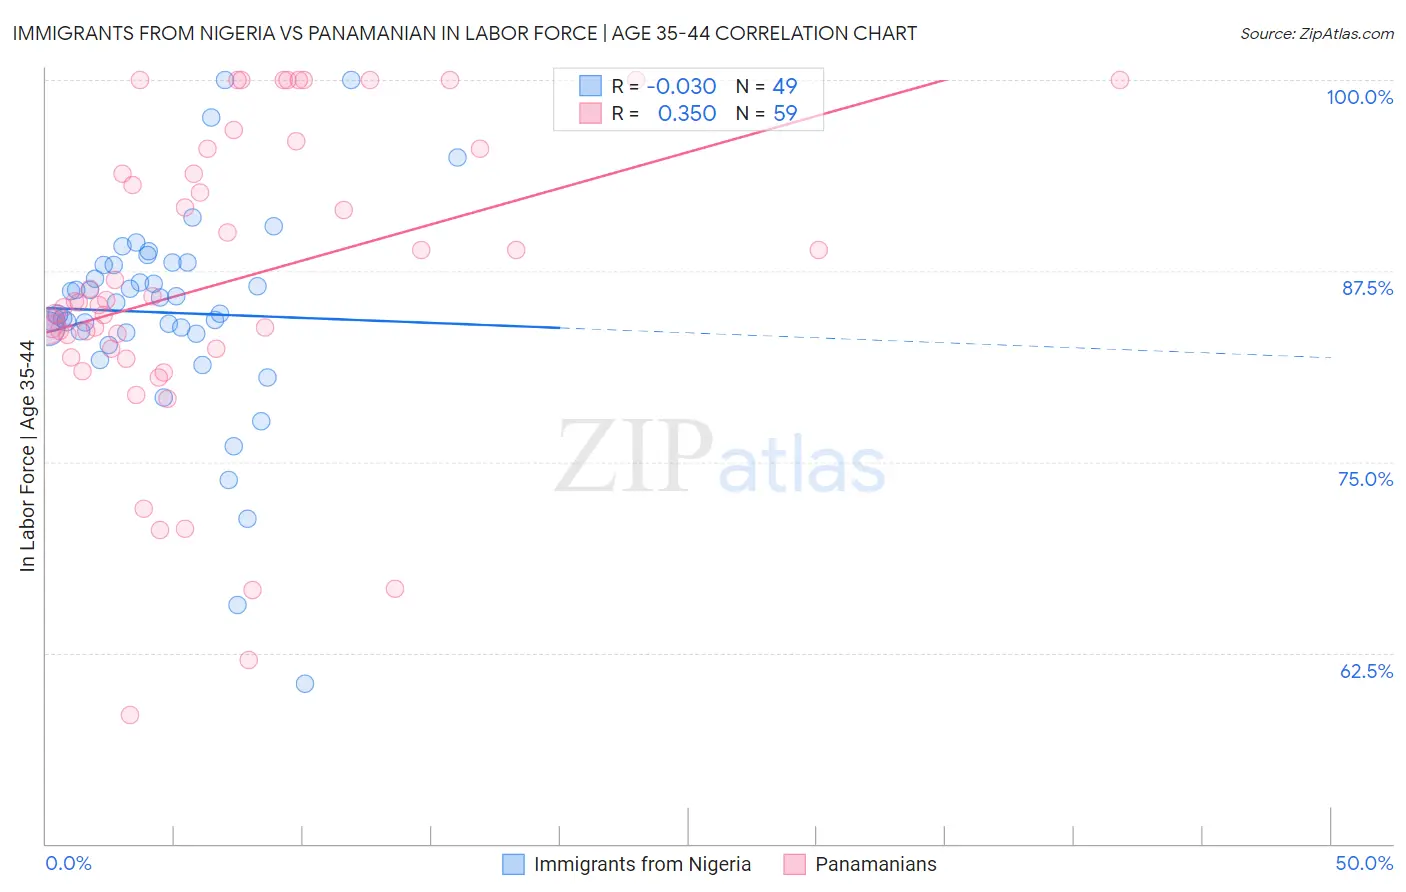
Immigrants from Nigeria vs Panamanian In Labor Force | Age 35-44 Correlation Chart
The statistical analysis conducted on geographies consisting of 283,331,334 people shows no correlation between the proportion of Immigrants from Nigeria and labor force participation rate among population between the ages 35 and 44 in the United States with a correlation coefficient (R) of -0.030 and weighted average of 84.5%. Similarly, the statistical analysis conducted on geographies consisting of 281,116,157 people shows a mild positive correlation between the proportion of Panamanians and labor force participation rate among population between the ages 35 and 44 in the United States with a correlation coefficient (R) of 0.350 and weighted average of 84.0%, a difference of 0.63%.
In Labor Force | Age 35-44 Correlation Summary
| Measurement | Immigrants from Nigeria | Panamanian |
| Minimum | 60.5% | 58.4% |
| Maximum | 100.0% | 100.0% |
| Range | 39.5% | 41.6% |
| Mean | 84.8% | 86.7% |
| Median | 85.4% | 85.5% |
| Interquartile 25% (IQ1) | 83.4% | 82.4% |
| Interquartile 75% (IQ3) | 88.0% | 95.5% |
| Interquartile Range (IQR) | 4.6% | 13.1% |
| Standard Deviation (Sample) | 7.1% | 10.1% |
| Standard Deviation (Population) | 7.0% | 10.0% |
Similar Demographics by In Labor Force | Age 35-44
Demographics Similar to Immigrants from Nigeria by In Labor Force | Age 35-44
In terms of in labor force | age 35-44, the demographic groups most similar to Immigrants from Nigeria are South American Indian (84.5%, a difference of 0.0%), Okinawan (84.5%, a difference of 0.0%), Romanian (84.5%, a difference of 0.010%), Immigrants from Taiwan (84.5%, a difference of 0.020%), and Immigrants from Netherlands (84.5%, a difference of 0.030%).
| Demographics | Rating | Rank | In Labor Force | Age 35-44 |
| Immigrants | Ukraine | 79.7 /100 | #143 | Good 84.6% |
| Immigrants | Jamaica | 79.4 /100 | #144 | Good 84.6% |
| Immigrants | Saudi Arabia | 79.4 /100 | #145 | Good 84.6% |
| Immigrants | Asia | 78.7 /100 | #146 | Good 84.5% |
| Immigrants | Netherlands | 76.6 /100 | #147 | Good 84.5% |
| South American Indians | 73.6 /100 | #148 | Good 84.5% |
| Okinawans | 73.5 /100 | #149 | Good 84.5% |
| Immigrants | Nigeria | 73.3 /100 | #150 | Good 84.5% |
| Romanians | 72.1 /100 | #151 | Good 84.5% |
| Immigrants | Taiwan | 71.4 /100 | #152 | Good 84.5% |
| Trinidadians and Tobagonians | 69.5 /100 | #153 | Good 84.5% |
| Iranians | 69.4 /100 | #154 | Good 84.5% |
| Immigrants | Switzerland | 65.9 /100 | #155 | Good 84.5% |
| Immigrants | Israel | 64.3 /100 | #156 | Good 84.4% |
| Immigrants | Austria | 63.8 /100 | #157 | Good 84.4% |
Demographics Similar to Panamanians by In Labor Force | Age 35-44
In terms of in labor force | age 35-44, the demographic groups most similar to Panamanians are British West Indian (84.0%, a difference of 0.0%), Welsh (84.0%, a difference of 0.0%), U.S. Virgin Islander (84.0%, a difference of 0.020%), Immigrants from Burma/Myanmar (84.0%, a difference of 0.020%), and Assyrian/Chaldean/Syriac (84.0%, a difference of 0.030%).
| Demographics | Rating | Rank | In Labor Force | Age 35-44 |
| Sub-Saharan Africans | 9.3 /100 | #219 | Tragic 84.1% |
| French | 7.5 /100 | #220 | Tragic 84.0% |
| Icelanders | 6.7 /100 | #221 | Tragic 84.0% |
| Assyrians/Chaldeans/Syriacs | 6.6 /100 | #222 | Tragic 84.0% |
| Immigrants | Panama | 6.4 /100 | #223 | Tragic 84.0% |
| U.S. Virgin Islanders | 6.1 /100 | #224 | Tragic 84.0% |
| Immigrants | Burma/Myanmar | 6.1 /100 | #225 | Tragic 84.0% |
| Panamanians | 5.4 /100 | #226 | Tragic 84.0% |
| British West Indians | 5.3 /100 | #227 | Tragic 84.0% |
| Welsh | 5.3 /100 | #228 | Tragic 84.0% |
| Immigrants | Thailand | 4.7 /100 | #229 | Tragic 84.0% |
| Immigrants | Iraq | 3.7 /100 | #230 | Tragic 83.9% |
| Scottish | 3.2 /100 | #231 | Tragic 83.9% |
| Native Hawaiians | 3.0 /100 | #232 | Tragic 83.9% |
| Immigrants | Germany | 2.8 /100 | #233 | Tragic 83.9% |