Immigrants from Moldova vs Mexican American Indian In Labor Force | Age 16-19

COMPARE

Immigrants from Moldova
Race
Ancestry
AfghanAfricanAlaska NativeAlaskan AthabascanAlbanianAleutAlsatianAmericanApacheArabArapahoArgentineanArmenianAssyrian/Chaldean/SyriacAustralianAustrianBahamianBangladeshiBarbadianBasqueBelgianBelizeanBermudanBhutaneseBlackfeetBolivianBrazilianBritishBritish West IndianBulgarianBurmeseCajunCambodianCanadianCape VerdeanCarpatho RusynCelticCentral AmericanCentral American IndianCherokeeCheyenneChickasawChileanChineseChippewaChoctawColombianColvilleComancheCosta RicanCreeCreekCroatianCrowCubanCypriotCzechCzechoslovakianDanishDelawareDominicanDutchDutch West IndianEastern EuropeanEcuadorianEgyptianEnglishEstonianEthiopianEuropeanFijianFilipinoFinnishFrenchFrench American IndianFrench CanadianGermanGerman RussianGhanaianGreekGuamanian/ChamorroGuatemalanGuyaneseHaitianHmongHonduranHopiHoumaHungarianIcelanderIndian (Asian)IndonesianInupiatIranianIraqiIrishIroquoisIsraeliItalianJamaicanJapaneseJordanianKenyanKiowaKoreanLaotianLatvianLebaneseLiberianLithuanianLumbeeLuxembourgerMacedonianMalaysianMalteseMarshalleseMenomineeMexicanMongolianMoroccanNative HawaiianNavajoNepaleseNew ZealanderNicaraguanNigerianNorthern EuropeanNorwegianOkinawanOsageOttawaPaiutePakistaniPalestinianPanamanianParaguayanPennsylvania GermanPeruvianPimaPolishPortuguesePotawatomiPuebloPuerto RicanPuget Sound SalishRomanianRussianSalvadoranSamoanScandinavianScotch-IrishScottishSeminoleSenegaleseSerbianShoshoneSierra LeoneanSiouxSlavicSlovakSloveneSomaliSouth AfricanSouth AmericanSouth American IndianSoviet UnionSpaniardSpanishSpanish AmericanSpanish American IndianSri LankanSubsaharan AfricanSudaneseSwedishSwissSyrianTaiwaneseThaiTlingit-HaidaTohono O'OdhamTonganTrinidadian and TobagonianTsimshianTurkishU.S. Virgin IslanderUgandanUkrainianUruguayanUteVenezuelanVietnameseWelshWest IndianYakamaYaquiYugoslavianYumanYup'ikZimbabwean
Immigration
NonimmigrantsImmigrantsAfghanistanAfricaAlbaniaArgentinaArmeniaAsiaAustraliaAustriaBahamasBangladeshBarbadosBelarusBelgiumBelizeBoliviaBosnia and HerzegovinaBrazilBulgariaBurma/MyanmarCabo VerdeCambodiaCameroonCanadaCaribbeanCentral AmericaChileChinaColombiaCongoCosta RicaCroatiaCubaCzechoslovakiaDenmarkDominicaDominican RepublicEastern AfricaEastern AsiaEastern EuropeEcuadorEgyptEl SalvadorEnglandEritreaEthiopiaEuropeFijiFranceGermanyGhanaGreeceGrenadaGuatemalaGuyanaHaitiHondurasHong KongHungaryIndiaIndonesiaIranIraqIrelandIsraelItalyJamaicaJapanJordanKazakhstanKenyaKoreaKuwaitLaosLatin AmericaLatviaLebanonLiberiaLithuaniaMalaysiaMexicoMicronesiaMiddle AfricaMoldovaMoroccoNepalNetherlandsNicaraguaNigeriaNorth AmericaNorth MacedoniaNorthern AfricaNorthern EuropeNorwayOceaniaPakistanPanamaPeruPhilippinesPolandPortugalRomaniaRussiaSaudi ArabiaScotlandSenegalSerbiaSierra LeoneSingaporeSomaliaSouth AfricaSouth AmericaSouth Central AsiaSouth Eastern AsiaSouthern EuropeSpainSri LankaSt. Vincent and the GrenadinesSudanSwedenSwitzerlandSyriaTaiwanThailandTrinidad and TobagoTurkeyUgandaUkraineUruguayUzbekistanVenezuelaVietnamWest IndiesWestern AfricaWestern AsiaWestern EuropeYemenZaireZimbabweAzores
Mexican American Indian
Race
Ancestry
AfghanAfricanAlaska NativeAlaskan AthabascanAlbanianAleutAlsatianAmericanApacheArabArapahoArgentineanArmenianAssyrian/Chaldean/SyriacAustralianAustrianBahamianBangladeshiBarbadianBasqueBelgianBelizeanBermudanBhutaneseBlackfeetBolivianBrazilianBritishBritish West IndianBulgarianBurmeseCajunCambodianCanadianCape VerdeanCarpatho RusynCelticCentral AmericanCentral American IndianCherokeeCheyenneChickasawChileanChineseChippewaChoctawColombianColvilleComancheCosta RicanCreeCreekCroatianCrowCubanCypriotCzechCzechoslovakianDanishDelawareDominicanDutchDutch West IndianEastern EuropeanEcuadorianEgyptianEnglishEstonianEthiopianEuropeanFijianFilipinoFinnishFrenchFrench American IndianFrench CanadianGermanGerman RussianGhanaianGreekGuamanian/ChamorroGuatemalanGuyaneseHaitianHmongHonduranHopiHoumaHungarianIcelanderIndian (Asian)IndonesianInupiatIranianIraqiIrishIroquoisIsraeliItalianJamaicanJapaneseJordanianKenyanKiowaKoreanLaotianLatvianLebaneseLiberianLithuanianLumbeeLuxembourgerMacedonianMalaysianMalteseMarshalleseMenomineeMexicanMexican American IndianMongolianMoroccanNative HawaiianNavajoNepaleseNew ZealanderNicaraguanNigerianNorthern EuropeanNorwegianOkinawanOsageOttawaPaiutePakistaniPalestinianPanamanianParaguayanPennsylvania GermanPeruvianPimaPolishPortuguesePotawatomiPuebloPuerto RicanPuget Sound SalishRomanianRussianSalvadoranSamoanScandinavianScotch-IrishScottishSeminoleSenegaleseSerbianShoshoneSierra LeoneanSiouxSlavicSlovakSloveneSomaliSouth AfricanSouth AmericanSouth American IndianSoviet UnionSpaniardSpanishSpanish AmericanSpanish American IndianSri LankanSubsaharan AfricanSudaneseSwedishSwissSyrianTaiwaneseThaiTlingit-HaidaTohono O'OdhamTonganTrinidadian and TobagonianTsimshianTurkishU.S. Virgin IslanderUgandanUkrainianUruguayanUteVenezuelanVietnameseWelshWest IndianYakamaYaquiYugoslavianYumanYup'ikZimbabwean
Immigration
NonimmigrantsImmigrantsAfghanistanAfricaAlbaniaArgentinaArmeniaAsiaAustraliaAustriaBahamasBangladeshBarbadosBelarusBelgiumBelizeBoliviaBosnia and HerzegovinaBrazilBulgariaBurma/MyanmarCabo VerdeCambodiaCameroonCanadaCaribbeanCentral AmericaChileChinaColombiaCongoCosta RicaCroatiaCubaCzechoslovakiaDenmarkDominicaDominican RepublicEastern AfricaEastern AsiaEastern EuropeEcuadorEgyptEl SalvadorEnglandEritreaEthiopiaEuropeFijiFranceGermanyGhanaGreeceGrenadaGuatemalaGuyanaHaitiHondurasHong KongHungaryIndiaIndonesiaIranIraqIrelandIsraelItalyJamaicaJapanJordanKazakhstanKenyaKoreaKuwaitLaosLatin AmericaLatviaLebanonLiberiaLithuaniaMalaysiaMexicoMicronesiaMiddle AfricaMoroccoNepalNetherlandsNicaraguaNigeriaNorth AmericaNorth MacedoniaNorthern AfricaNorthern EuropeNorwayOceaniaPakistanPanamaPeruPhilippinesPolandPortugalRomaniaRussiaSaudi ArabiaScotlandSenegalSerbiaSierra LeoneSingaporeSomaliaSouth AfricaSouth AmericaSouth Central AsiaSouth Eastern AsiaSouthern EuropeSpainSri LankaSt. Vincent and the GrenadinesSudanSwedenSwitzerlandSyriaTaiwanThailandTrinidad and TobagoTurkeyUgandaUkraineUruguayUzbekistanVenezuelaVietnamWest IndiesWestern AfricaWestern AsiaWestern EuropeYemenZaireZimbabweAzores
In Labor Force | Age 16-19
Income
Poverty
Unemployment
Labor Participation
Family Structure
Vehicle Availability
Education Level
Disability

In Labor Force | Age 16-19 Comparison

Immigrants from Moldova

Mexican American Indians

Exceptional
Fair
37.7%
IN LABOR FORCE | AGE 16-19
91.9/ 100
METRIC RATING
139th/ 347
METRIC RANK
36.0%
IN LABOR FORCE | AGE 16-19
21.1/ 100
METRIC RATING
196th/ 347
METRIC RANK

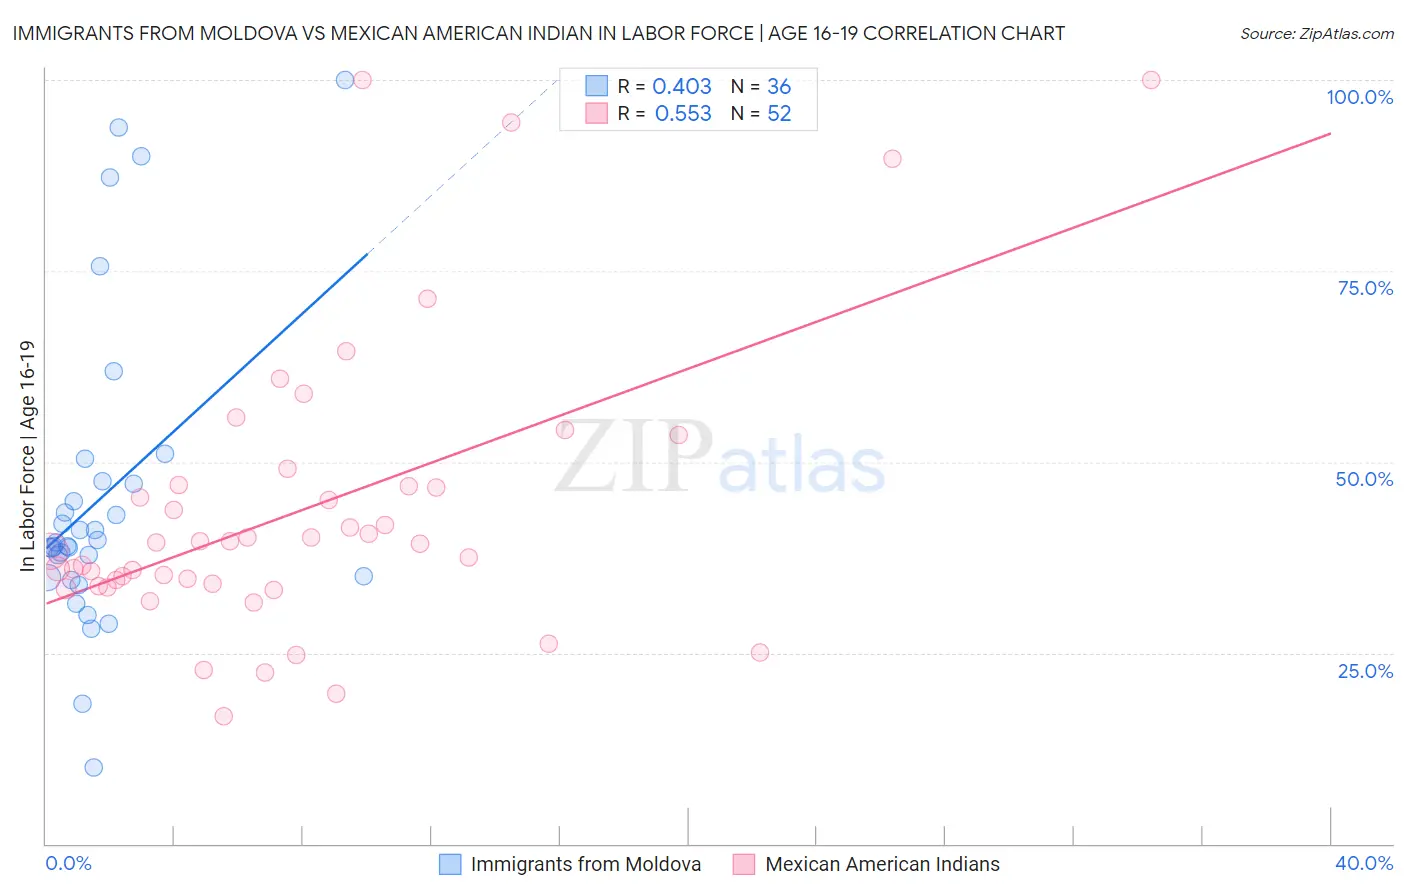
Immigrants from Moldova vs Mexican American Indian In Labor Force | Age 16-19 Correlation Chart

The statistical analysis conducted on geographies consisting of 124,314,308 people shows a moderate positive correlation between the proportion of Immigrants from Moldova and labor force participation rate among population between the ages 16 and 19 in the United States with a correlation coefficient (R) of 0.403 and weighted average of 37.7%. Similarly, the statistical analysis conducted on geographies consisting of 317,325,894 people shows a substantial positive correlation between the proportion of Mexican American Indians and labor force participation rate among population between the ages 16 and 19 in the United States with a correlation coefficient (R) of 0.553 and weighted average of 36.0%, a difference of 4.8%.
Immigrants from Moldova vs Mexican American Indian In Labor Force | Age 16-19

In Labor Force | Age 16-19 Correlation Summary

MeasurementImmigrants from MoldovaMexican American Indian
Minimum10.0%16.6%
Maximum100.0%100.0%
Range90.0%83.4%
Mean45.3%43.7%
Median39.2%39.4%
Interquartile 25% (IQ1)34.9%33.9%
Interquartile 75% (IQ3)47.3%46.8%
Interquartile Range (IQR)12.4%12.9%
Standard Deviation (Sample)20.2%18.8%
Standard Deviation (Population)19.9%18.6%

Similar Demographics by In Labor Force | Age 16-19

Demographics Similar to Immigrants from Moldova by In Labor Force | Age 16-19

In terms of in labor force | age 16-19, the demographic groups most similar to Immigrants from Moldova are Comanche (37.7%, a difference of 0.010%), Estonian (37.7%, a difference of 0.030%), Syrian (37.6%, a difference of 0.17%), Australian (37.8%, a difference of 0.24%), and Cajun (37.8%, a difference of 0.24%).
DemographicsRating | RankIn Labor Force | Age 16-19
Immigrants | Oceania
94.7
/100
|
#132
Exceptional
37.9%
Cheyenne
94.6
/100
|
#133
Exceptional
37.9%
Immigrants | Netherlands
93.7
/100
|
#134
Exceptional
37.8%
Macedonians
93.4
/100
|
#135
Exceptional
37.8%
Australians
93.2
/100
|
#136
Exceptional
37.8%
Cajuns
93.2
/100
|
#137
Exceptional
37.8%
Comanche
91.9
/100
|
#138
Exceptional
37.7%
Immigrants | Moldova
91.9
/100
|
#139
Exceptional
37.7%
Estonians
91.7
/100
|
#140
Exceptional
37.7%
Syrians
90.7
/100
|
#141
Exceptional
37.6%
Sierra Leoneans
89.7
/100
|
#142
Excellent
37.6%
Pakistanis
89.5
/100
|
#143
Excellent
37.6%
Japanese
89.3
/100
|
#144
Excellent
37.5%
Paiute
89.3
/100
|
#145
Excellent
37.5%
Immigrants | Western Europe
88.9
/100
|
#146
Excellent
37.5%

Demographics Similar to Mexican American Indians by In Labor Force | Age 16-19

In terms of in labor force | age 16-19, the demographic groups most similar to Mexican American Indians are Immigrants from Serbia (36.0%, a difference of 0.010%), Immigrants from Northern Africa (35.9%, a difference of 0.090%), Immigrants from Norway (35.9%, a difference of 0.10%), Bolivian (36.0%, a difference of 0.16%), and Immigrants from Sweden (35.9%, a difference of 0.18%).
DemographicsRating | RankIn Labor Force | Age 16-19
Immigrants | Hungary
28.8
/100
|
#189
Fair
36.2%
Panamanians
28.6
/100
|
#190
Fair
36.1%
Immigrants | Croatia
27.5
/100
|
#191
Fair
36.1%
Afghans
25.7
/100
|
#192
Fair
36.1%
Immigrants | Denmark
25.0
/100
|
#193
Fair
36.1%
Nigerians
24.6
/100
|
#194
Fair
36.1%
Bolivians
23.3
/100
|
#195
Fair
36.0%
Mexican American Indians
21.1
/100
|
#196
Fair
36.0%
Immigrants | Serbia
21.0
/100
|
#197
Fair
36.0%
Immigrants | Northern Africa
19.9
/100
|
#198
Poor
35.9%
Immigrants | Norway
19.8
/100
|
#199
Poor
35.9%
Immigrants | Sweden
18.8
/100
|
#200
Poor
35.9%
Alsatians
17.5
/100
|
#201
Poor
35.9%
Senegalese
17.4
/100
|
#202
Poor
35.9%
Immigrants | Nigeria
16.8
/100
|
#203
Poor
35.8%