Immigrants from Mexico vs French In Labor Force | Age 16-19

COMPARE

Immigrants from Mexico
Race
Ancestry
AfghanAfricanAlaska NativeAlaskan AthabascanAlbanianAleutAlsatianAmericanApacheArabArapahoArgentineanArmenianAssyrian/Chaldean/SyriacAustralianAustrianBahamianBangladeshiBarbadianBasqueBelgianBelizeanBermudanBhutaneseBlackfeetBolivianBrazilianBritishBritish West IndianBulgarianBurmeseCajunCambodianCanadianCape VerdeanCarpatho RusynCelticCentral AmericanCentral American IndianCherokeeCheyenneChickasawChileanChineseChippewaChoctawColombianColvilleComancheCosta RicanCreeCreekCroatianCrowCubanCypriotCzechCzechoslovakianDanishDelawareDominicanDutchDutch West IndianEastern EuropeanEcuadorianEgyptianEnglishEstonianEthiopianEuropeanFijianFilipinoFinnishFrench American IndianFrench CanadianGermanGerman RussianGhanaianGreekGuamanian/ChamorroGuatemalanGuyaneseHaitianHmongHonduranHopiHoumaHungarianIcelanderIndian (Asian)IndonesianInupiatIranianIraqiIrishIroquoisIsraeliItalianJamaicanJapaneseJordanianKenyanKiowaKoreanLaotianLatvianLebaneseLiberianLithuanianLumbeeLuxembourgerMacedonianMalaysianMalteseMarshalleseMenomineeMexicanMexican American IndianMongolianMoroccanNative HawaiianNavajoNepaleseNew ZealanderNicaraguanNigerianNorthern EuropeanNorwegianOkinawanOsageOttawaPaiutePakistaniPalestinianPanamanianParaguayanPennsylvania GermanPeruvianPimaPolishPortuguesePotawatomiPuebloPuerto RicanPuget Sound SalishRomanianRussianSalvadoranSamoanScandinavianScotch-IrishScottishSeminoleSenegaleseSerbianShoshoneSierra LeoneanSiouxSlavicSlovakSloveneSomaliSouth AfricanSouth AmericanSouth American IndianSoviet UnionSpaniardSpanishSpanish AmericanSpanish American IndianSri LankanSubsaharan AfricanSudaneseSwedishSwissSyrianTaiwaneseThaiTlingit-HaidaTohono O'OdhamTonganTrinidadian and TobagonianTsimshianTurkishU.S. Virgin IslanderUgandanUkrainianUruguayanUteVenezuelanVietnameseWelshWest IndianYakamaYaquiYugoslavianYumanYup'ikZimbabwean
Immigration
NonimmigrantsImmigrantsAfghanistanAfricaAlbaniaArgentinaArmeniaAsiaAustraliaAustriaBahamasBangladeshBarbadosBelarusBelgiumBelizeBoliviaBosnia and HerzegovinaBrazilBulgariaBurma/MyanmarCabo VerdeCambodiaCameroonCanadaCaribbeanCentral AmericaChileChinaColombiaCongoCosta RicaCroatiaCubaCzechoslovakiaDenmarkDominicaDominican RepublicEastern AfricaEastern AsiaEastern EuropeEcuadorEgyptEl SalvadorEnglandEritreaEthiopiaEuropeFijiFranceGermanyGhanaGreeceGrenadaGuatemalaGuyanaHaitiHondurasHong KongHungaryIndiaIndonesiaIranIraqIrelandIsraelItalyJamaicaJapanJordanKazakhstanKenyaKoreaKuwaitLaosLatin AmericaLatviaLebanonLiberiaLithuaniaMalaysiaMexicoMicronesiaMiddle AfricaMoldovaMoroccoNepalNetherlandsNicaraguaNigeriaNorth AmericaNorth MacedoniaNorthern AfricaNorthern EuropeNorwayOceaniaPakistanPanamaPeruPhilippinesPolandPortugalRomaniaRussiaSaudi ArabiaScotlandSenegalSerbiaSierra LeoneSingaporeSomaliaSouth AfricaSouth AmericaSouth Central AsiaSouth Eastern AsiaSouthern EuropeSpainSri LankaSt. Vincent and the GrenadinesSudanSwedenSwitzerlandSyriaTaiwanThailandTrinidad and TobagoTurkeyUgandaUkraineUruguayUzbekistanVenezuelaVietnamWest IndiesWestern AfricaWestern AsiaWestern EuropeYemenZaireZimbabweAzores
French
Race
Ancestry
AfghanAfricanAlaska NativeAlaskan AthabascanAlbanianAleutAlsatianAmericanApacheArabArapahoArgentineanArmenianAssyrian/Chaldean/SyriacAustralianAustrianBahamianBangladeshiBarbadianBasqueBelgianBelizeanBermudanBhutaneseBlackfeetBolivianBrazilianBritishBritish West IndianBulgarianBurmeseCajunCambodianCanadianCape VerdeanCarpatho RusynCelticCentral AmericanCentral American IndianCherokeeCheyenneChickasawChileanChineseChippewaChoctawColombianColvilleComancheCosta RicanCreeCreekCroatianCrowCubanCypriotCzechCzechoslovakianDanishDelawareDominicanDutchDutch West IndianEastern EuropeanEcuadorianEgyptianEnglishEstonianEthiopianEuropeanFijianFilipinoFinnishFrenchFrench American IndianFrench CanadianGermanGerman RussianGhanaianGreekGuamanian/ChamorroGuatemalanGuyaneseHaitianHmongHonduranHopiHoumaHungarianIcelanderIndian (Asian)IndonesianInupiatIranianIraqiIrishIroquoisIsraeliItalianJamaicanJapaneseJordanianKenyanKiowaKoreanLaotianLatvianLebaneseLiberianLithuanianLumbeeLuxembourgerMacedonianMalaysianMalteseMarshalleseMenomineeMexicanMexican American IndianMongolianMoroccanNative HawaiianNavajoNepaleseNew ZealanderNicaraguanNigerianNorthern EuropeanNorwegianOkinawanOsageOttawaPaiutePakistaniPalestinianPanamanianParaguayanPennsylvania GermanPeruvianPimaPolishPortuguesePotawatomiPuebloPuerto RicanPuget Sound SalishRomanianRussianSalvadoranSamoanScandinavianScotch-IrishScottishSeminoleSenegaleseSerbianShoshoneSierra LeoneanSiouxSlavicSlovakSloveneSomaliSouth AfricanSouth AmericanSouth American IndianSoviet UnionSpaniardSpanishSpanish AmericanSpanish American IndianSri LankanSubsaharan AfricanSudaneseSwedishSwissSyrianTaiwaneseThaiTlingit-HaidaTohono O'OdhamTonganTrinidadian and TobagonianTsimshianTurkishU.S. Virgin IslanderUgandanUkrainianUruguayanUteVenezuelanVietnameseWelshWest IndianYakamaYaquiYugoslavianYumanYup'ikZimbabwean
Immigration
NonimmigrantsImmigrantsAfghanistanAfricaAlbaniaArgentinaArmeniaAsiaAustraliaAustriaBahamasBangladeshBarbadosBelarusBelgiumBelizeBoliviaBosnia and HerzegovinaBrazilBulgariaBurma/MyanmarCabo VerdeCambodiaCameroonCanadaCaribbeanCentral AmericaChileChinaColombiaCongoCosta RicaCroatiaCubaCzechoslovakiaDenmarkDominicaDominican RepublicEastern AfricaEastern AsiaEastern EuropeEcuadorEgyptEl SalvadorEnglandEritreaEthiopiaEuropeFijiFranceGermanyGhanaGreeceGrenadaGuatemalaGuyanaHaitiHondurasHong KongHungaryIndiaIndonesiaIranIraqIrelandIsraelItalyJamaicaJapanJordanKazakhstanKenyaKoreaKuwaitLaosLatin AmericaLatviaLebanonLiberiaLithuaniaMalaysiaMicronesiaMiddle AfricaMoldovaMoroccoNepalNetherlandsNicaraguaNigeriaNorth AmericaNorth MacedoniaNorthern AfricaNorthern EuropeNorwayOceaniaPakistanPanamaPeruPhilippinesPolandPortugalRomaniaRussiaSaudi ArabiaScotlandSenegalSerbiaSierra LeoneSingaporeSomaliaSouth AfricaSouth AmericaSouth Central AsiaSouth Eastern AsiaSouthern EuropeSpainSri LankaSt. Vincent and the GrenadinesSudanSwedenSwitzerlandSyriaTaiwanThailandTrinidad and TobagoTurkeyUgandaUkraineUruguayUzbekistanVenezuelaVietnamWest IndiesWestern AfricaWestern AsiaWestern EuropeYemenZaireZimbabweAzores
In Labor Force | Age 16-19
Income
Poverty
Unemployment
Labor Participation
Family Structure
Vehicle Availability
Education Level
Disability

In Labor Force | Age 16-19 Comparison

Immigrants from Mexico

French

Tragic
Exceptional
35.1%
IN LABOR FORCE | AGE 16-19
4.2/ 100
METRIC RATING
234th/ 347
METRIC RANK
42.1%
IN LABOR FORCE | AGE 16-19
100.0/ 100
METRIC RATING
29th/ 347
METRIC RANK

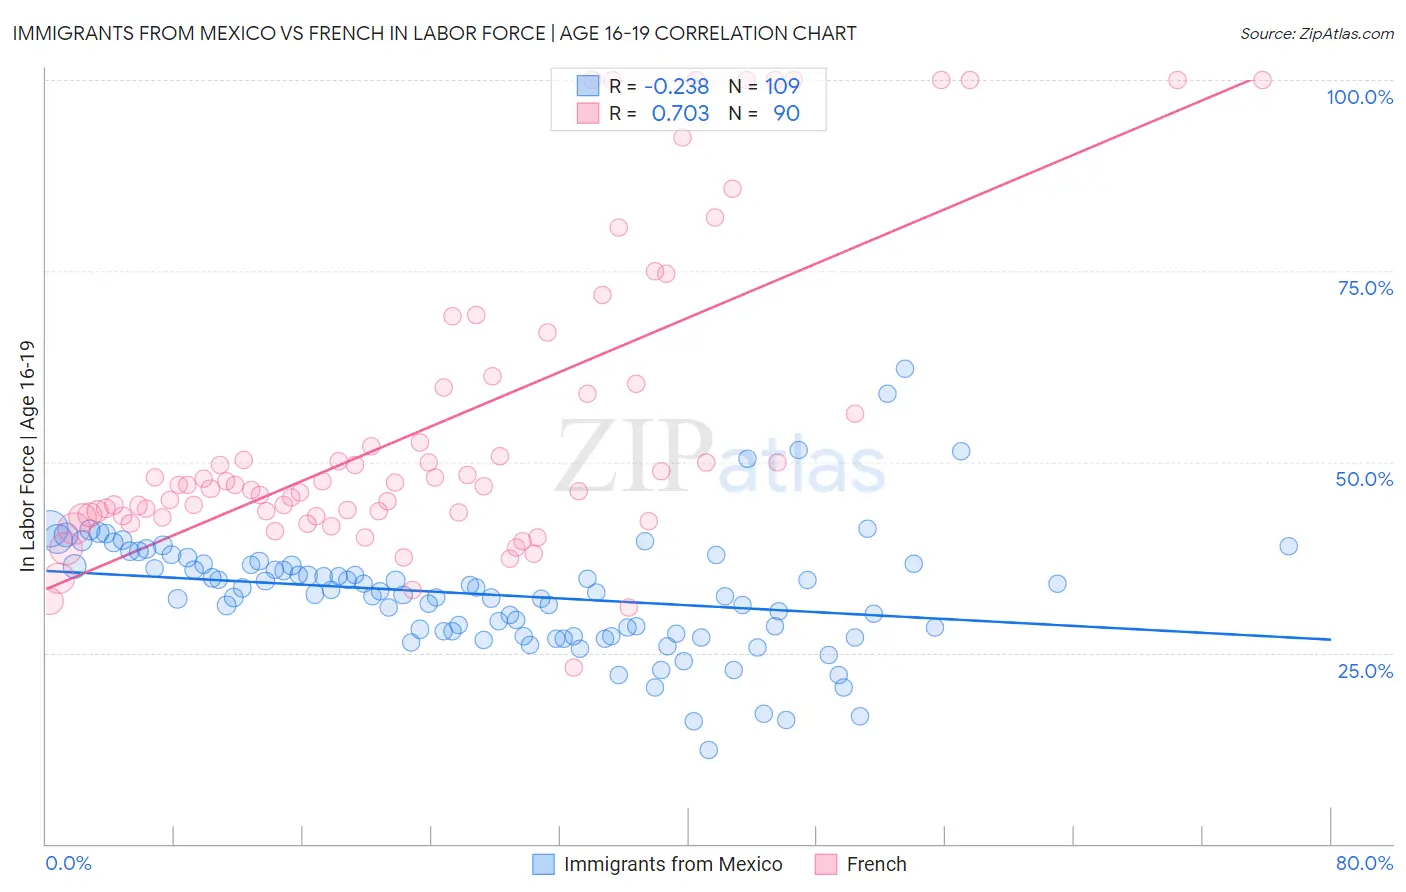
Immigrants from Mexico vs French In Labor Force | Age 16-19 Correlation Chart

The statistical analysis conducted on geographies consisting of 511,656,414 people shows a weak negative correlation between the proportion of Immigrants from Mexico and labor force participation rate among population between the ages 16 and 19 in the United States with a correlation coefficient (R) of -0.238 and weighted average of 35.1%. Similarly, the statistical analysis conducted on geographies consisting of 568,177,224 people shows a strong positive correlation between the proportion of French and labor force participation rate among population between the ages 16 and 19 in the United States with a correlation coefficient (R) of 0.703 and weighted average of 42.1%, a difference of 19.9%.
Immigrants from Mexico vs French In Labor Force | Age 16-19

In Labor Force | Age 16-19 Correlation Summary

MeasurementImmigrants from MexicoFrench
Minimum12.3%23.1%
Maximum62.2%100.0%
Range49.9%76.9%
Mean32.6%54.6%
Median32.7%47.0%
Interquartile 25% (IQ1)27.4%43.0%
Interquartile 75% (IQ3)36.5%59.8%
Interquartile Range (IQR)9.1%16.9%
Standard Deviation (Sample)7.9%20.0%
Standard Deviation (Population)7.9%19.9%

Similar Demographics by In Labor Force | Age 16-19

Demographics Similar to Immigrants from Mexico by In Labor Force | Age 16-19

In terms of in labor force | age 16-19, the demographic groups most similar to Immigrants from Mexico are Immigrants from France (35.1%, a difference of 0.040%), Immigrants from Syria (35.2%, a difference of 0.080%), Immigrants from Kazakhstan (35.2%, a difference of 0.080%), Immigrants from Philippines (35.1%, a difference of 0.080%), and Immigrants from Honduras (35.2%, a difference of 0.20%).
DemographicsRating | RankIn Labor Force | Age 16-19
Mongolians
5.7
/100
|
#227
Tragic
35.3%
Immigrants | Senegal
5.5
/100
|
#228
Tragic
35.3%
Immigrants | Lebanon
5.0
/100
|
#229
Tragic
35.2%
Immigrants | Honduras
4.9
/100
|
#230
Tragic
35.2%
Immigrants | Syria
4.5
/100
|
#231
Tragic
35.2%
Immigrants | Kazakhstan
4.5
/100
|
#232
Tragic
35.2%
Immigrants | France
4.3
/100
|
#233
Tragic
35.1%
Immigrants | Mexico
4.2
/100
|
#234
Tragic
35.1%
Immigrants | Philippines
4.0
/100
|
#235
Tragic
35.1%
Immigrants | Australia
3.6
/100
|
#236
Tragic
35.1%
Immigrants | India
3.5
/100
|
#237
Tragic
35.0%
Immigrants | Vietnam
3.4
/100
|
#238
Tragic
35.0%
Inupiat
3.2
/100
|
#239
Tragic
35.0%
Immigrants | Central America
3.0
/100
|
#240
Tragic
35.0%
Immigrants | Ireland
2.9
/100
|
#241
Tragic
35.0%

Demographics Similar to French by In Labor Force | Age 16-19

In terms of in labor force | age 16-19, the demographic groups most similar to French are Polish (42.1%, a difference of 0.050%), Scottish (42.0%, a difference of 0.28%), Welsh (42.3%, a difference of 0.35%), Irish (42.0%, a difference of 0.35%), and Czechoslovakian (41.9%, a difference of 0.55%).
DemographicsRating | RankIn Labor Force | Age 16-19
Sudanese
100.0
/100
|
#22
Exceptional
42.9%
Slovaks
100.0
/100
|
#23
Exceptional
42.6%
Bangladeshis
100.0
/100
|
#24
Exceptional
42.5%
German Russians
100.0
/100
|
#25
Exceptional
42.4%
English
100.0
/100
|
#26
Exceptional
42.4%
Welsh
100.0
/100
|
#27
Exceptional
42.3%
Poles
100.0
/100
|
#28
Exceptional
42.1%
French
100.0
/100
|
#29
Exceptional
42.1%
Scottish
100.0
/100
|
#30
Exceptional
42.0%
Irish
100.0
/100
|
#31
Exceptional
42.0%
Czechoslovakians
100.0
/100
|
#32
Exceptional
41.9%
Liberians
100.0
/100
|
#33
Exceptional
41.8%
Immigrants | Bosnia and Herzegovina
100.0
/100
|
#34
Exceptional
41.8%
Yugoslavians
100.0
/100
|
#35
Exceptional
41.8%
Immigrants | Azores
100.0
/100
|
#36
Exceptional
41.7%