Immigrants from Malaysia vs Immigrants from Japan In Labor Force | Age > 16

COMPARE

Immigrants from Malaysia
Race
Ancestry
AfghanAfricanAlaska NativeAlaskan AthabascanAlbanianAleutAlsatianAmericanApacheArabArapahoArgentineanArmenianAssyrian/Chaldean/SyriacAustralianAustrianBahamianBangladeshiBarbadianBasqueBelgianBelizeanBermudanBhutaneseBlackfeetBolivianBrazilianBritishBritish West IndianBulgarianBurmeseCajunCambodianCanadianCape VerdeanCarpatho RusynCelticCentral AmericanCentral American IndianCherokeeCheyenneChickasawChileanChineseChippewaChoctawColombianColvilleComancheCosta RicanCreeCreekCroatianCrowCubanCypriotCzechCzechoslovakianDanishDelawareDominicanDutchDutch West IndianEastern EuropeanEcuadorianEgyptianEnglishEstonianEthiopianEuropeanFijianFilipinoFinnishFrenchFrench American IndianFrench CanadianGermanGerman RussianGhanaianGreekGuamanian/ChamorroGuatemalanGuyaneseHaitianHmongHonduranHopiHoumaHungarianIcelanderIndian (Asian)IndonesianInupiatIranianIraqiIrishIroquoisIsraeliItalianJamaicanJapaneseJordanianKenyanKiowaKoreanLaotianLatvianLebaneseLiberianLithuanianLumbeeLuxembourgerMacedonianMalaysianMalteseMarshalleseMenomineeMexicanMexican American IndianMongolianMoroccanNative HawaiianNavajoNepaleseNew ZealanderNicaraguanNigerianNorthern EuropeanNorwegianOkinawanOsageOttawaPaiutePakistaniPalestinianPanamanianParaguayanPennsylvania GermanPeruvianPimaPolishPortuguesePotawatomiPuebloPuerto RicanPuget Sound SalishRomanianRussianSalvadoranSamoanScandinavianScotch-IrishScottishSeminoleSenegaleseSerbianShoshoneSierra LeoneanSiouxSlavicSlovakSloveneSomaliSouth AfricanSouth AmericanSouth American IndianSoviet UnionSpaniardSpanishSpanish AmericanSpanish American IndianSri LankanSubsaharan AfricanSudaneseSwedishSwissSyrianTaiwaneseThaiTlingit-HaidaTohono O'OdhamTonganTrinidadian and TobagonianTsimshianTurkishU.S. Virgin IslanderUgandanUkrainianUruguayanUteVenezuelanVietnameseWelshWest IndianYakamaYaquiYugoslavianYumanYup'ikZimbabwean
Immigration
NonimmigrantsImmigrantsAfghanistanAfricaAlbaniaArgentinaArmeniaAsiaAustraliaAustriaBahamasBangladeshBarbadosBelarusBelgiumBelizeBoliviaBosnia and HerzegovinaBrazilBulgariaBurma/MyanmarCabo VerdeCambodiaCameroonCanadaCaribbeanCentral AmericaChileChinaColombiaCongoCosta RicaCroatiaCubaCzechoslovakiaDenmarkDominicaDominican RepublicEastern AfricaEastern AsiaEastern EuropeEcuadorEgyptEl SalvadorEnglandEritreaEthiopiaEuropeFijiFranceGermanyGhanaGreeceGrenadaGuatemalaGuyanaHaitiHondurasHong KongHungaryIndiaIndonesiaIranIraqIrelandIsraelItalyJamaicaJordanKazakhstanKenyaKoreaKuwaitLaosLatin AmericaLatviaLebanonLiberiaLithuaniaMalaysiaMexicoMicronesiaMiddle AfricaMoldovaMoroccoNepalNetherlandsNicaraguaNigeriaNorth AmericaNorth MacedoniaNorthern AfricaNorthern EuropeNorwayOceaniaPakistanPanamaPeruPhilippinesPolandPortugalRomaniaRussiaSaudi ArabiaScotlandSenegalSerbiaSierra LeoneSingaporeSomaliaSouth AfricaSouth AmericaSouth Central AsiaSouth Eastern AsiaSouthern EuropeSpainSri LankaSt. Vincent and the GrenadinesSudanSwedenSwitzerlandSyriaTaiwanThailandTrinidad and TobagoTurkeyUgandaUkraineUruguayUzbekistanVenezuelaVietnamWest IndiesWestern AfricaWestern AsiaWestern EuropeYemenZaireZimbabweAzores
Immigrants from Japan
Race
Ancestry
AfghanAfricanAlaska NativeAlaskan AthabascanAlbanianAleutAlsatianAmericanApacheArabArapahoArgentineanArmenianAssyrian/Chaldean/SyriacAustralianAustrianBahamianBangladeshiBarbadianBasqueBelgianBelizeanBermudanBhutaneseBlackfeetBolivianBrazilianBritishBritish West IndianBulgarianBurmeseCajunCambodianCanadianCape VerdeanCarpatho RusynCelticCentral AmericanCentral American IndianCherokeeCheyenneChickasawChileanChineseChippewaChoctawColombianColvilleComancheCosta RicanCreeCreekCroatianCrowCubanCypriotCzechCzechoslovakianDanishDelawareDominicanDutchDutch West IndianEastern EuropeanEcuadorianEgyptianEnglishEstonianEthiopianEuropeanFijianFilipinoFinnishFrenchFrench American IndianFrench CanadianGermanGerman RussianGhanaianGreekGuamanian/ChamorroGuatemalanGuyaneseHaitianHmongHonduranHopiHoumaHungarianIcelanderIndian (Asian)IndonesianInupiatIranianIraqiIrishIroquoisIsraeliItalianJamaicanJapaneseJordanianKenyanKiowaKoreanLaotianLatvianLebaneseLiberianLithuanianLumbeeLuxembourgerMacedonianMalaysianMalteseMarshalleseMenomineeMexicanMexican American IndianMongolianMoroccanNative HawaiianNavajoNepaleseNew ZealanderNicaraguanNigerianNorthern EuropeanNorwegianOkinawanOsageOttawaPaiutePakistaniPalestinianPanamanianParaguayanPennsylvania GermanPeruvianPimaPolishPortuguesePotawatomiPuebloPuerto RicanPuget Sound SalishRomanianRussianSalvadoranSamoanScandinavianScotch-IrishScottishSeminoleSenegaleseSerbianShoshoneSierra LeoneanSiouxSlavicSlovakSloveneSomaliSouth AfricanSouth AmericanSouth American IndianSoviet UnionSpaniardSpanishSpanish AmericanSpanish American IndianSri LankanSubsaharan AfricanSudaneseSwedishSwissSyrianTaiwaneseThaiTlingit-HaidaTohono O'OdhamTonganTrinidadian and TobagonianTsimshianTurkishU.S. Virgin IslanderUgandanUkrainianUruguayanUteVenezuelanVietnameseWelshWest IndianYakamaYaquiYugoslavianYumanYup'ikZimbabwean
Immigration
NonimmigrantsImmigrantsAfghanistanAfricaAlbaniaArgentinaArmeniaAsiaAustraliaAustriaBahamasBangladeshBarbadosBelarusBelgiumBelizeBoliviaBosnia and HerzegovinaBrazilBulgariaBurma/MyanmarCabo VerdeCambodiaCameroonCanadaCaribbeanCentral AmericaChileChinaColombiaCongoCosta RicaCroatiaCubaCzechoslovakiaDenmarkDominicaDominican RepublicEastern AfricaEastern AsiaEastern EuropeEcuadorEgyptEl SalvadorEnglandEritreaEthiopiaEuropeFijiFranceGermanyGhanaGreeceGrenadaGuatemalaGuyanaHaitiHondurasHong KongHungaryIndiaIndonesiaIranIraqIrelandIsraelItalyJamaicaJapanJordanKazakhstanKenyaKoreaKuwaitLaosLatin AmericaLatviaLebanonLiberiaLithuaniaMexicoMicronesiaMiddle AfricaMoldovaMoroccoNepalNetherlandsNicaraguaNigeriaNorth AmericaNorth MacedoniaNorthern AfricaNorthern EuropeNorwayOceaniaPakistanPanamaPeruPhilippinesPolandPortugalRomaniaRussiaSaudi ArabiaScotlandSenegalSerbiaSierra LeoneSingaporeSomaliaSouth AfricaSouth AmericaSouth Central AsiaSouth Eastern AsiaSouthern EuropeSpainSri LankaSt. Vincent and the GrenadinesSudanSwedenSwitzerlandSyriaTaiwanThailandTrinidad and TobagoTurkeyUgandaUkraineUruguayUzbekistanVenezuelaVietnamWest IndiesWestern AfricaWestern AsiaWestern EuropeYemenZaireZimbabweAzores
In Labor Force | Age > 16
Income
Poverty
Unemployment
Labor Participation
Family Structure
Vehicle Availability
Education Level
Disability

In Labor Force | Age > 16 Comparison

Immigrants from Malaysia

Immigrants from Japan

Exceptional
Exceptional
66.1%
IN LABOR FORCE | AGE > 16
99.6/ 100
METRIC RATING
76th/ 347
METRIC RANK
65.8%
IN LABOR FORCE | AGE > 16
98.0/ 100
METRIC RATING
109th/ 347
METRIC RANK

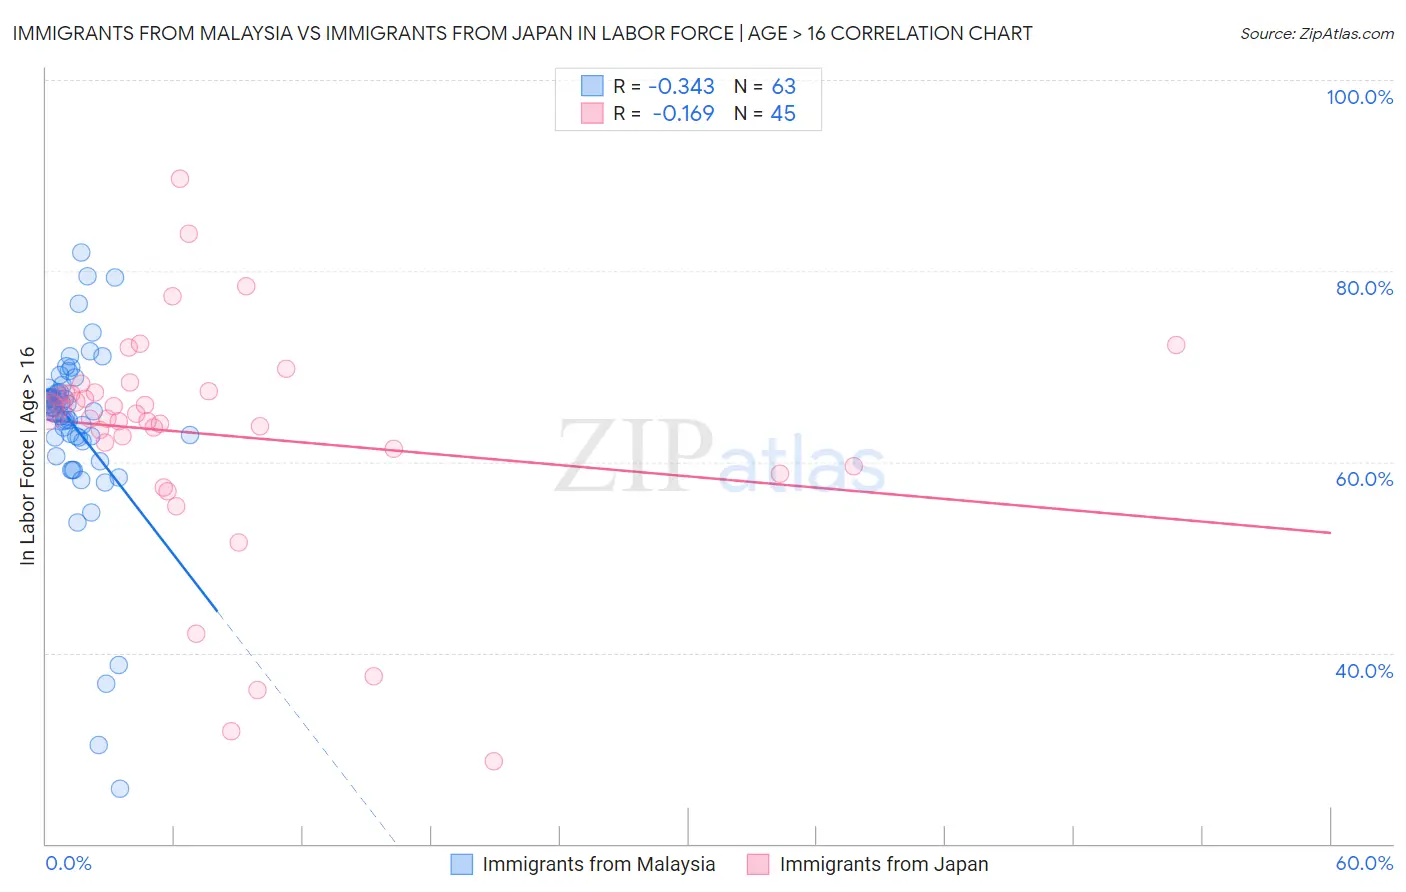
Immigrants from Malaysia vs Immigrants from Japan In Labor Force | Age > 16 Correlation Chart

The statistical analysis conducted on geographies consisting of 197,973,684 people shows a mild negative correlation between the proportion of Immigrants from Malaysia and labor force participation rate among population ages 16 and over in the United States with a correlation coefficient (R) of -0.343 and weighted average of 66.1%. Similarly, the statistical analysis conducted on geographies consisting of 340,160,245 people shows a poor negative correlation between the proportion of Immigrants from Japan and labor force participation rate among population ages 16 and over in the United States with a correlation coefficient (R) of -0.169 and weighted average of 65.8%, a difference of 0.47%.
Immigrants from Malaysia vs Immigrants from Japan In Labor Force | Age > 16

In Labor Force | Age > 16 Correlation Summary

MeasurementImmigrants from MalaysiaImmigrants from Japan
Minimum25.8%28.6%
Maximum81.9%89.6%
Range56.1%61.0%
Mean63.7%62.9%
Median65.7%65.1%
Interquartile 25% (IQ1)62.5%60.5%
Interquartile 75% (IQ3)67.3%67.3%
Interquartile Range (IQR)4.8%6.8%
Standard Deviation (Sample)9.7%12.0%
Standard Deviation (Population)9.6%11.9%

Similar Demographics by In Labor Force | Age > 16

Demographics Similar to Immigrants from Malaysia by In Labor Force | Age > 16

In terms of in labor force | age > 16, the demographic groups most similar to Immigrants from Malaysia are Immigrants from Moldova (66.1%, a difference of 0.010%), Immigrants from Asia (66.1%, a difference of 0.010%), Turkish (66.1%, a difference of 0.040%), Immigrants from Singapore (66.2%, a difference of 0.050%), and Malaysian (66.1%, a difference of 0.050%).
DemographicsRating | RankIn Labor Force | Age > 16
Sub-Saharan Africans
99.7
/100
|
#69
Exceptional
66.2%
Asians
99.7
/100
|
#70
Exceptional
66.2%
Burmese
99.7
/100
|
#71
Exceptional
66.2%
Taiwanese
99.7
/100
|
#72
Exceptional
66.2%
Immigrants | Vietnam
99.7
/100
|
#73
Exceptional
66.2%
Immigrants | Korea
99.7
/100
|
#74
Exceptional
66.2%
Immigrants | Singapore
99.7
/100
|
#75
Exceptional
66.2%
Immigrants | Malaysia
99.6
/100
|
#76
Exceptional
66.1%
Immigrants | Moldova
99.6
/100
|
#77
Exceptional
66.1%
Immigrants | Asia
99.6
/100
|
#78
Exceptional
66.1%
Turks
99.6
/100
|
#79
Exceptional
66.1%
Malaysians
99.6
/100
|
#80
Exceptional
66.1%
Moroccans
99.5
/100
|
#81
Exceptional
66.1%
German Russians
99.4
/100
|
#82
Exceptional
66.1%
Immigrants | Jordan
99.4
/100
|
#83
Exceptional
66.1%

Demographics Similar to Immigrants from Japan by In Labor Force | Age > 16

In terms of in labor force | age > 16, the demographic groups most similar to Immigrants from Japan are Immigrants from Spain (65.8%, a difference of 0.0%), Immigrants from Serbia (65.8%, a difference of 0.020%), Immigrants from Poland (65.8%, a difference of 0.020%), Japanese (65.8%, a difference of 0.040%), and Colombian (65.9%, a difference of 0.060%).
DemographicsRating | RankIn Labor Force | Age > 16
Uruguayans
98.6
/100
|
#102
Exceptional
65.9%
Immigrants | South Eastern Asia
98.5
/100
|
#103
Exceptional
65.9%
Palestinians
98.5
/100
|
#104
Exceptional
65.9%
Colombians
98.4
/100
|
#105
Exceptional
65.9%
Immigrants | Serbia
98.1
/100
|
#106
Exceptional
65.8%
Immigrants | Poland
98.1
/100
|
#107
Exceptional
65.8%
Immigrants | Spain
98.0
/100
|
#108
Exceptional
65.8%
Immigrants | Japan
98.0
/100
|
#109
Exceptional
65.8%
Japanese
97.7
/100
|
#110
Exceptional
65.8%
Immigrants | Honduras
97.5
/100
|
#111
Exceptional
65.8%
Laotians
97.4
/100
|
#112
Exceptional
65.8%
Pakistanis
97.1
/100
|
#113
Exceptional
65.8%
Hondurans
97.1
/100
|
#114
Exceptional
65.8%
Immigrants | Indonesia
96.8
/100
|
#115
Exceptional
65.7%
Argentineans
96.7
/100
|
#116
Exceptional
65.7%