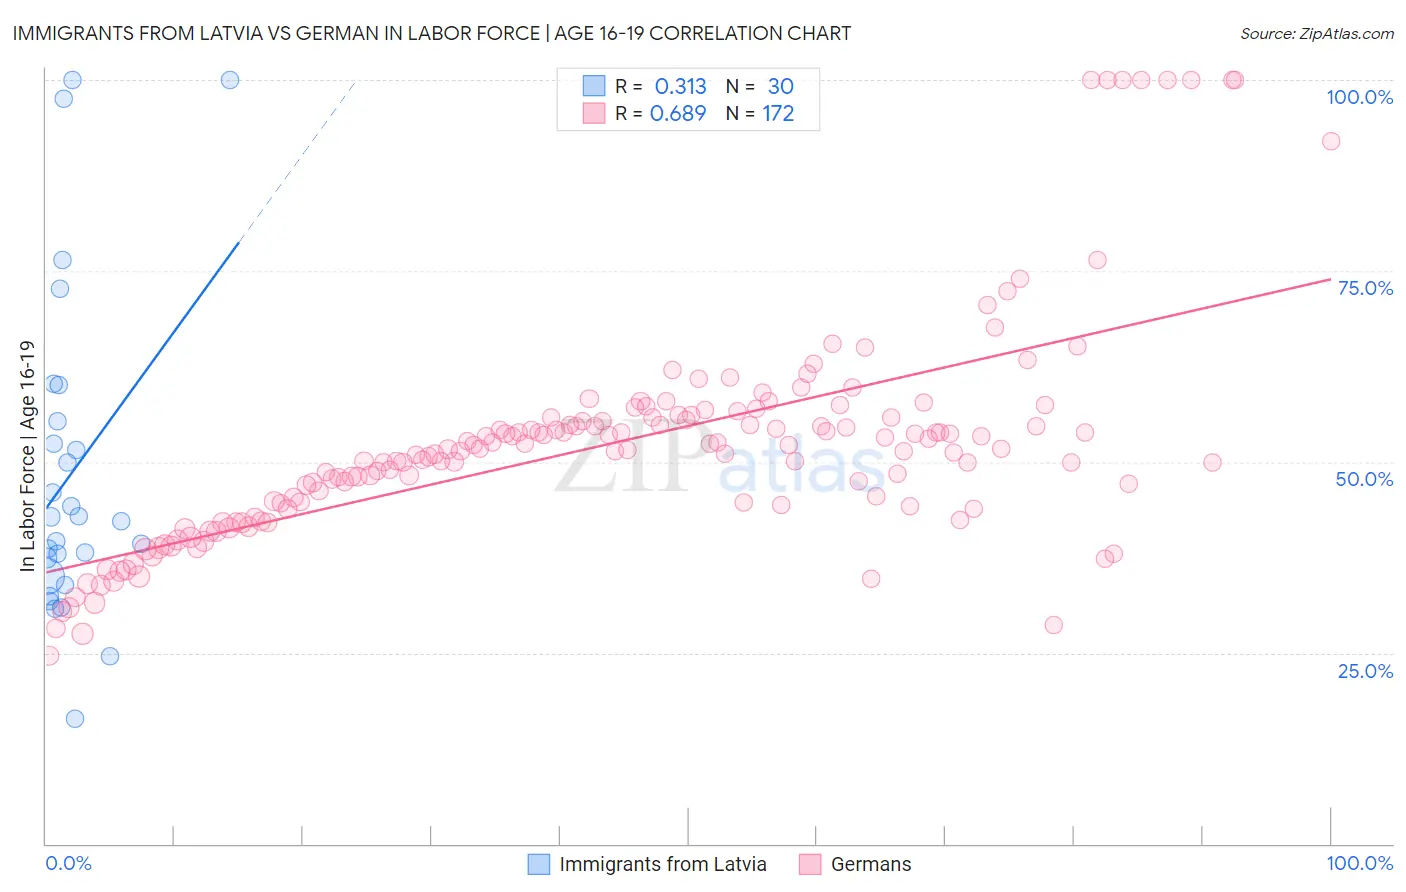
Immigrants from Latvia vs German In Labor Force | Age 16-19
COMPARE
Immigrants from Latvia
German
In Labor Force | Age 16-19
In Labor Force | Age 16-19 Comparison
Immigrants from Latvia
Germans
36.8%
IN LABOR FORCE | AGE 16-19
61.6/ 100
METRIC RATING
169th/ 347
METRIC RANK
44.2%
IN LABOR FORCE | AGE 16-19
100.0/ 100
METRIC RATING
10th/ 347
METRIC RANK
Immigrants from Latvia vs German In Labor Force | Age 16-19 Correlation Chart
The statistical analysis conducted on geographies consisting of 113,686,535 people shows a mild positive correlation between the proportion of Immigrants from Latvia and labor force participation rate among population between the ages 16 and 19 in the United States with a correlation coefficient (R) of 0.313 and weighted average of 36.8%. Similarly, the statistical analysis conducted on geographies consisting of 575,301,683 people shows a significant positive correlation between the proportion of Germans and labor force participation rate among population between the ages 16 and 19 in the United States with a correlation coefficient (R) of 0.689 and weighted average of 44.2%, a difference of 20.1%.
In Labor Force | Age 16-19 Correlation Summary
| Measurement | Immigrants from Latvia | German |
| Minimum | 16.4% | 24.6% |
| Maximum | 100.0% | 100.0% |
| Range | 83.6% | 75.4% |
| Mean | 48.7% | 52.2% |
| Median | 42.6% | 51.6% |
| Interquartile 25% (IQ1) | 35.0% | 44.2% |
| Interquartile 75% (IQ3) | 55.3% | 55.7% |
| Interquartile Range (IQR) | 20.3% | 11.4% |
| Standard Deviation (Sample) | 21.4% | 14.3% |
| Standard Deviation (Population) | 21.1% | 14.2% |
Similar Demographics by In Labor Force | Age 16-19
Demographics Similar to Immigrants from Latvia by In Labor Force | Age 16-19
In terms of in labor force | age 16-19, the demographic groups most similar to Immigrants from Latvia are Immigrants from South Africa (36.8%, a difference of 0.060%), Palestinian (36.8%, a difference of 0.080%), Arab (36.8%, a difference of 0.11%), Immigrants from Cambodia (36.7%, a difference of 0.17%), and South African (36.7%, a difference of 0.17%).
| Demographics | Rating | Rank | In Labor Force | Age 16-19 |
| Immigrants | Jordan | 69.5 /100 | #162 | Good 36.9% |
| Bermudans | 69.3 /100 | #163 | Good 36.9% |
| Immigrants | Kuwait | 68.9 /100 | #164 | Good 36.9% |
| Yakama | 66.9 /100 | #165 | Good 36.9% |
| Immigrants | Western Africa | 66.7 /100 | #166 | Good 36.9% |
| Arabs | 63.6 /100 | #167 | Good 36.8% |
| Palestinians | 63.1 /100 | #168 | Good 36.8% |
| Immigrants | Latvia | 61.6 /100 | #169 | Good 36.8% |
| Immigrants | South Africa | 60.5 /100 | #170 | Good 36.8% |
| Immigrants | Cambodia | 58.4 /100 | #171 | Average 36.7% |
| South Africans | 58.3 /100 | #172 | Average 36.7% |
| Russians | 57.5 /100 | #173 | Average 36.7% |
| Immigrants | Czechoslovakia | 50.0 /100 | #174 | Average 36.6% |
| Natives/Alaskans | 49.0 /100 | #175 | Average 36.6% |
| Albanians | 48.8 /100 | #176 | Average 36.5% |
Demographics Similar to Germans by In Labor Force | Age 16-19
In terms of in labor force | age 16-19, the demographic groups most similar to Germans are Swedish (44.1%, a difference of 0.080%), Finnish (43.9%, a difference of 0.54%), Dutch (43.8%, a difference of 0.73%), Cape Verdean (44.5%, a difference of 0.74%), and Chippewa (43.8%, a difference of 0.83%).
| Demographics | Rating | Rank | In Labor Force | Age 16-19 |
| Immigrants | Somalia | 100.0 /100 | #3 | Exceptional 45.6% |
| Luxembourgers | 100.0 /100 | #4 | Exceptional 45.3% |
| Alaskan Athabascans | 100.0 /100 | #5 | Exceptional 45.2% |
| Somalis | 100.0 /100 | #6 | Exceptional 45.1% |
| Danes | 100.0 /100 | #7 | Exceptional 44.7% |
| Immigrants | Cabo Verde | 100.0 /100 | #8 | Exceptional 44.7% |
| Cape Verdeans | 100.0 /100 | #9 | Exceptional 44.5% |
| Germans | 100.0 /100 | #10 | Exceptional 44.2% |
| Swedes | 100.0 /100 | #11 | Exceptional 44.1% |
| Finns | 100.0 /100 | #12 | Exceptional 43.9% |
| Dutch | 100.0 /100 | #13 | Exceptional 43.8% |
| Chippewa | 100.0 /100 | #14 | Exceptional 43.8% |
| Slovenes | 100.0 /100 | #15 | Exceptional 43.7% |
| Czechs | 100.0 /100 | #16 | Exceptional 43.6% |
| Scandinavians | 100.0 /100 | #17 | Exceptional 43.6% |