Immigrants from Latin America vs Immigrants from Italy In Labor Force | Age 35-44
COMPARE
Immigrants from Latin America
Immigrants from Italy
In Labor Force | Age 35-44
In Labor Force | Age 35-44 Comparison
Immigrants from Latin America
Immigrants from Italy
82.8%
IN LABOR FORCE | AGE 35-44
0.0/ 100
METRIC RATING
292nd/ 347
METRIC RANK
85.0%
IN LABOR FORCE | AGE 35-44
99.1/ 100
METRIC RATING
67th/ 347
METRIC RANK
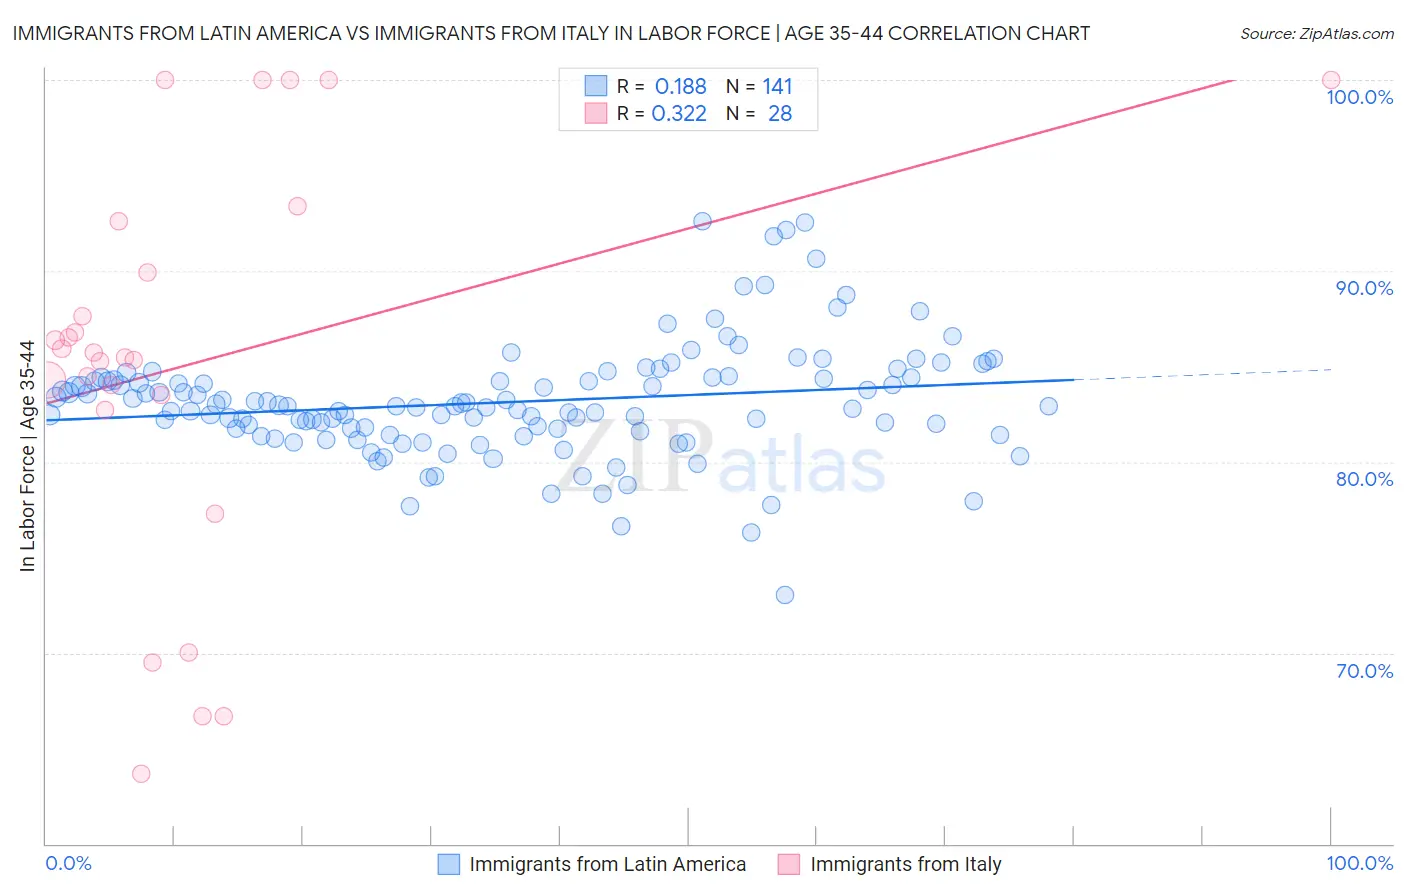
Immigrants from Latin America vs Immigrants from Italy In Labor Force | Age 35-44 Correlation Chart
The statistical analysis conducted on geographies consisting of 558,011,354 people shows a poor positive correlation between the proportion of Immigrants from Latin America and labor force participation rate among population between the ages 35 and 44 in the United States with a correlation coefficient (R) of 0.188 and weighted average of 82.8%. Similarly, the statistical analysis conducted on geographies consisting of 324,156,768 people shows a mild positive correlation between the proportion of Immigrants from Italy and labor force participation rate among population between the ages 35 and 44 in the United States with a correlation coefficient (R) of 0.322 and weighted average of 85.0%, a difference of 2.6%.
In Labor Force | Age 35-44 Correlation Summary
| Measurement | Immigrants from Latin America | Immigrants from Italy |
| Minimum | 73.0% | 63.7% |
| Maximum | 92.6% | 100.0% |
| Range | 19.6% | 36.3% |
| Mean | 83.1% | 85.1% |
| Median | 82.9% | 85.6% |
| Interquartile 25% (IQ1) | 81.7% | 83.1% |
| Interquartile 75% (IQ3) | 84.4% | 91.2% |
| Interquartile Range (IQR) | 2.7% | 8.1% |
| Standard Deviation (Sample) | 3.0% | 10.5% |
| Standard Deviation (Population) | 3.0% | 10.3% |
Similar Demographics by In Labor Force | Age 35-44
Demographics Similar to Immigrants from Latin America by In Labor Force | Age 35-44
In terms of in labor force | age 35-44, the demographic groups most similar to Immigrants from Latin America are Pennsylvania German (82.9%, a difference of 0.050%), African (82.9%, a difference of 0.070%), Chippewa (82.9%, a difference of 0.080%), Puget Sound Salish (82.9%, a difference of 0.090%), and Spanish American (82.8%, a difference of 0.090%).
| Demographics | Rating | Rank | In Labor Force | Age 35-44 |
| Fijians | 0.0 /100 | #285 | Tragic 82.9% |
| Immigrants | Bangladesh | 0.0 /100 | #286 | Tragic 82.9% |
| Immigrants | Belize | 0.0 /100 | #287 | Tragic 82.9% |
| Puget Sound Salish | 0.0 /100 | #288 | Tragic 82.9% |
| Chippewa | 0.0 /100 | #289 | Tragic 82.9% |
| Africans | 0.0 /100 | #290 | Tragic 82.9% |
| Pennsylvania Germans | 0.0 /100 | #291 | Tragic 82.9% |
| Immigrants | Latin America | 0.0 /100 | #292 | Tragic 82.8% |
| Spanish Americans | 0.0 /100 | #293 | Tragic 82.8% |
| Potawatomi | 0.0 /100 | #294 | Tragic 82.7% |
| Immigrants | Lebanon | 0.0 /100 | #295 | Tragic 82.7% |
| Mexican American Indians | 0.0 /100 | #296 | Tragic 82.6% |
| Hmong | 0.0 /100 | #297 | Tragic 82.6% |
| Ottawa | 0.0 /100 | #298 | Tragic 82.6% |
| Tlingit-Haida | 0.0 /100 | #299 | Tragic 82.5% |
Demographics Similar to Immigrants from Italy by In Labor Force | Age 35-44
In terms of in labor force | age 35-44, the demographic groups most similar to Immigrants from Italy are Italian (85.0%, a difference of 0.0%), Immigrants from Brazil (85.0%, a difference of 0.010%), Immigrants from Haiti (85.0%, a difference of 0.010%), Sudanese (85.0%, a difference of 0.010%), and Swedish (85.0%, a difference of 0.020%).
| Demographics | Rating | Rank | In Labor Force | Age 35-44 |
| Albanians | 99.4 /100 | #60 | Exceptional 85.1% |
| Immigrants | Latvia | 99.3 /100 | #61 | Exceptional 85.0% |
| Immigrants | Moldova | 99.3 /100 | #62 | Exceptional 85.0% |
| Immigrants | Uganda | 99.3 /100 | #63 | Exceptional 85.0% |
| Swedes | 99.2 /100 | #64 | Exceptional 85.0% |
| Immigrants | Brazil | 99.2 /100 | #65 | Exceptional 85.0% |
| Immigrants | Haiti | 99.1 /100 | #66 | Exceptional 85.0% |
| Immigrants | Italy | 99.1 /100 | #67 | Exceptional 85.0% |
| Italians | 99.1 /100 | #68 | Exceptional 85.0% |
| Sudanese | 99.0 /100 | #69 | Exceptional 85.0% |
| Brazilians | 99.0 /100 | #70 | Exceptional 85.0% |
| Russians | 99.0 /100 | #71 | Exceptional 85.0% |
| Immigrants | Singapore | 98.9 /100 | #72 | Exceptional 85.0% |
| Immigrants | Sri Lanka | 98.9 /100 | #73 | Exceptional 85.0% |
| Colombians | 98.8 /100 | #74 | Exceptional 85.0% |