Immigrants from Latin America vs Egyptian In Labor Force | Age 20-24
COMPARE
Immigrants from Latin America
Egyptian
In Labor Force | Age 20-24
In Labor Force | Age 20-24 Comparison
Immigrants from Latin America
Egyptians
74.1%
IN LABOR FORCE | AGE 20-24
2.7/ 100
METRIC RATING
239th/ 347
METRIC RANK
73.7%
IN LABOR FORCE | AGE 20-24
0.7/ 100
METRIC RATING
258th/ 347
METRIC RANK
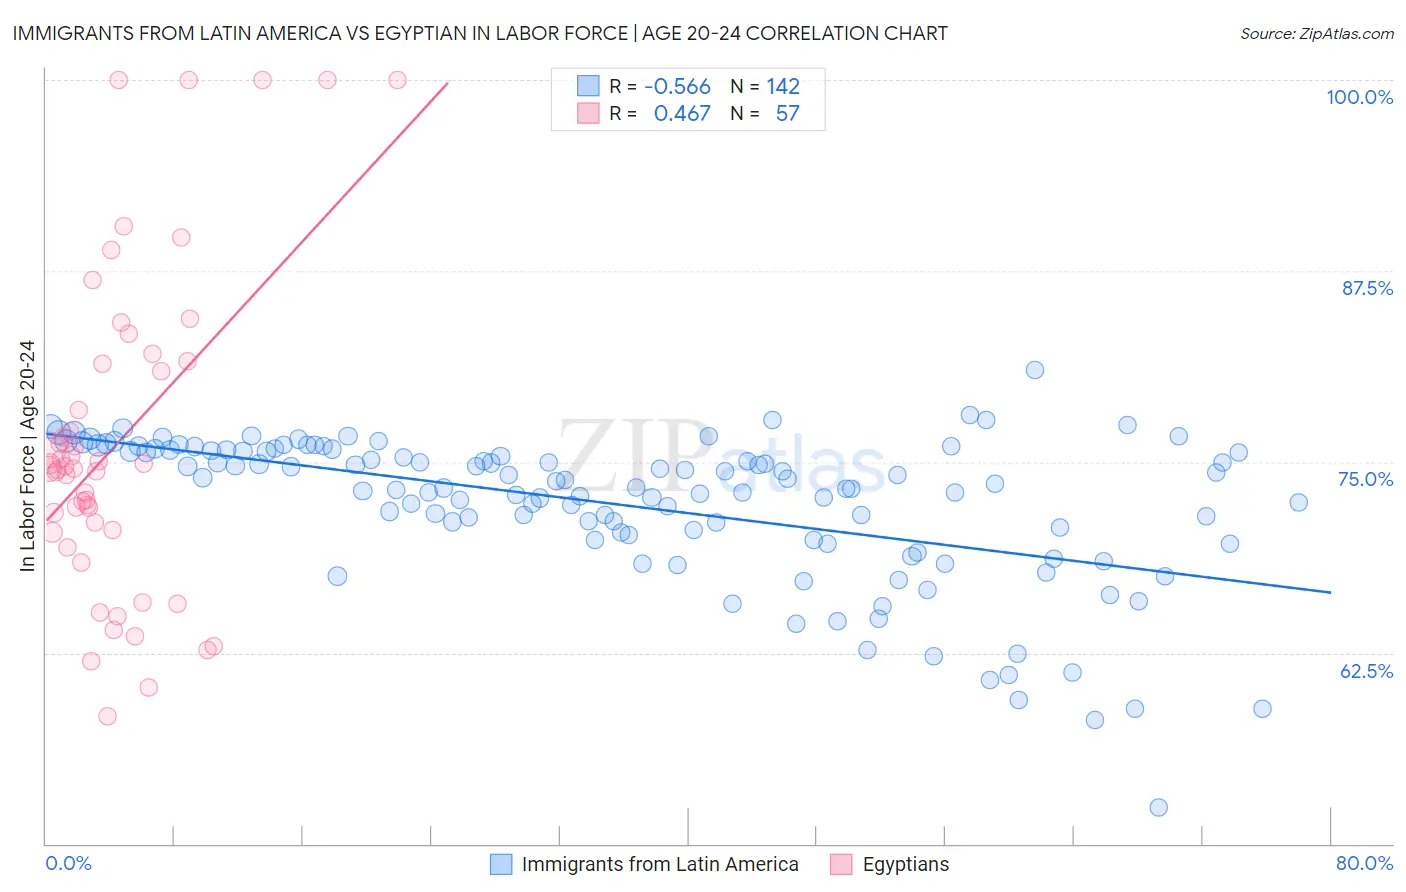
Immigrants from Latin America vs Egyptian In Labor Force | Age 20-24 Correlation Chart
The statistical analysis conducted on geographies consisting of 557,642,628 people shows a substantial negative correlation between the proportion of Immigrants from Latin America and labor force participation rate among population between the ages 20 and 24 in the United States with a correlation coefficient (R) of -0.566 and weighted average of 74.1%. Similarly, the statistical analysis conducted on geographies consisting of 276,889,106 people shows a moderate positive correlation between the proportion of Egyptians and labor force participation rate among population between the ages 20 and 24 in the United States with a correlation coefficient (R) of 0.467 and weighted average of 73.7%, a difference of 0.50%.
In Labor Force | Age 20-24 Correlation Summary
| Measurement | Immigrants from Latin America | Egyptian |
| Minimum | 52.4% | 58.3% |
| Maximum | 81.0% | 100.0% |
| Range | 28.6% | 41.7% |
| Mean | 72.2% | 76.2% |
| Median | 73.5% | 74.6% |
| Interquartile 25% (IQ1) | 70.2% | 70.5% |
| Interquartile 75% (IQ3) | 75.7% | 81.5% |
| Interquartile Range (IQR) | 5.6% | 11.0% |
| Standard Deviation (Sample) | 4.9% | 10.4% |
| Standard Deviation (Population) | 4.9% | 10.3% |
Demographics Similar to Immigrants from Latin America and Egyptians by In Labor Force | Age 20-24
In terms of in labor force | age 20-24, the demographic groups most similar to Immigrants from Latin America are Immigrants from Japan (74.1%, a difference of 0.040%), Immigrants from Sri Lanka (74.0%, a difference of 0.060%), Immigrants from Senegal (74.0%, a difference of 0.090%), Thai (74.0%, a difference of 0.10%), and Immigrants from Syria (74.0%, a difference of 0.12%). Similarly, the demographic groups most similar to Egyptians are Paraguayan (73.7%, a difference of 0.040%), Spanish American Indian (73.7%, a difference of 0.060%), Immigrants from Pakistan (73.8%, a difference of 0.10%), Arapaho (73.8%, a difference of 0.13%), and Ute (73.8%, a difference of 0.13%).
| Demographics | Rating | Rank | In Labor Force | Age 20-24 |
| Immigrants | Japan | 3.0 /100 | #238 | Tragic 74.1% |
| Immigrants | Latin America | 2.7 /100 | #239 | Tragic 74.1% |
| Immigrants | Sri Lanka | 2.3 /100 | #240 | Tragic 74.0% |
| Immigrants | Senegal | 2.1 /100 | #241 | Tragic 74.0% |
| Thais | 2.1 /100 | #242 | Tragic 74.0% |
| Immigrants | Syria | 1.9 /100 | #243 | Tragic 74.0% |
| Immigrants | South Central Asia | 1.9 /100 | #244 | Tragic 74.0% |
| Turks | 1.8 /100 | #245 | Tragic 73.9% |
| Immigrants | Panama | 1.6 /100 | #246 | Tragic 73.9% |
| Colville | 1.5 /100 | #247 | Tragic 73.9% |
| Immigrants | Saudi Arabia | 1.5 /100 | #248 | Tragic 73.9% |
| Blacks/African Americans | 1.3 /100 | #249 | Tragic 73.9% |
| Immigrants | Belgium | 1.3 /100 | #250 | Tragic 73.9% |
| Immigrants | Egypt | 1.2 /100 | #251 | Tragic 73.8% |
| Immigrants | Kazakhstan | 1.1 /100 | #252 | Tragic 73.8% |
| Arapaho | 1.0 /100 | #253 | Tragic 73.8% |
| Ute | 1.0 /100 | #254 | Tragic 73.8% |
| Immigrants | Pakistan | 0.9 /100 | #255 | Tragic 73.8% |
| Spanish American Indians | 0.8 /100 | #256 | Tragic 73.7% |
| Paraguayans | 0.8 /100 | #257 | Tragic 73.7% |
| Egyptians | 0.7 /100 | #258 | Tragic 73.7% |